G Plots for abundance response with information theory covariates
## [[1]]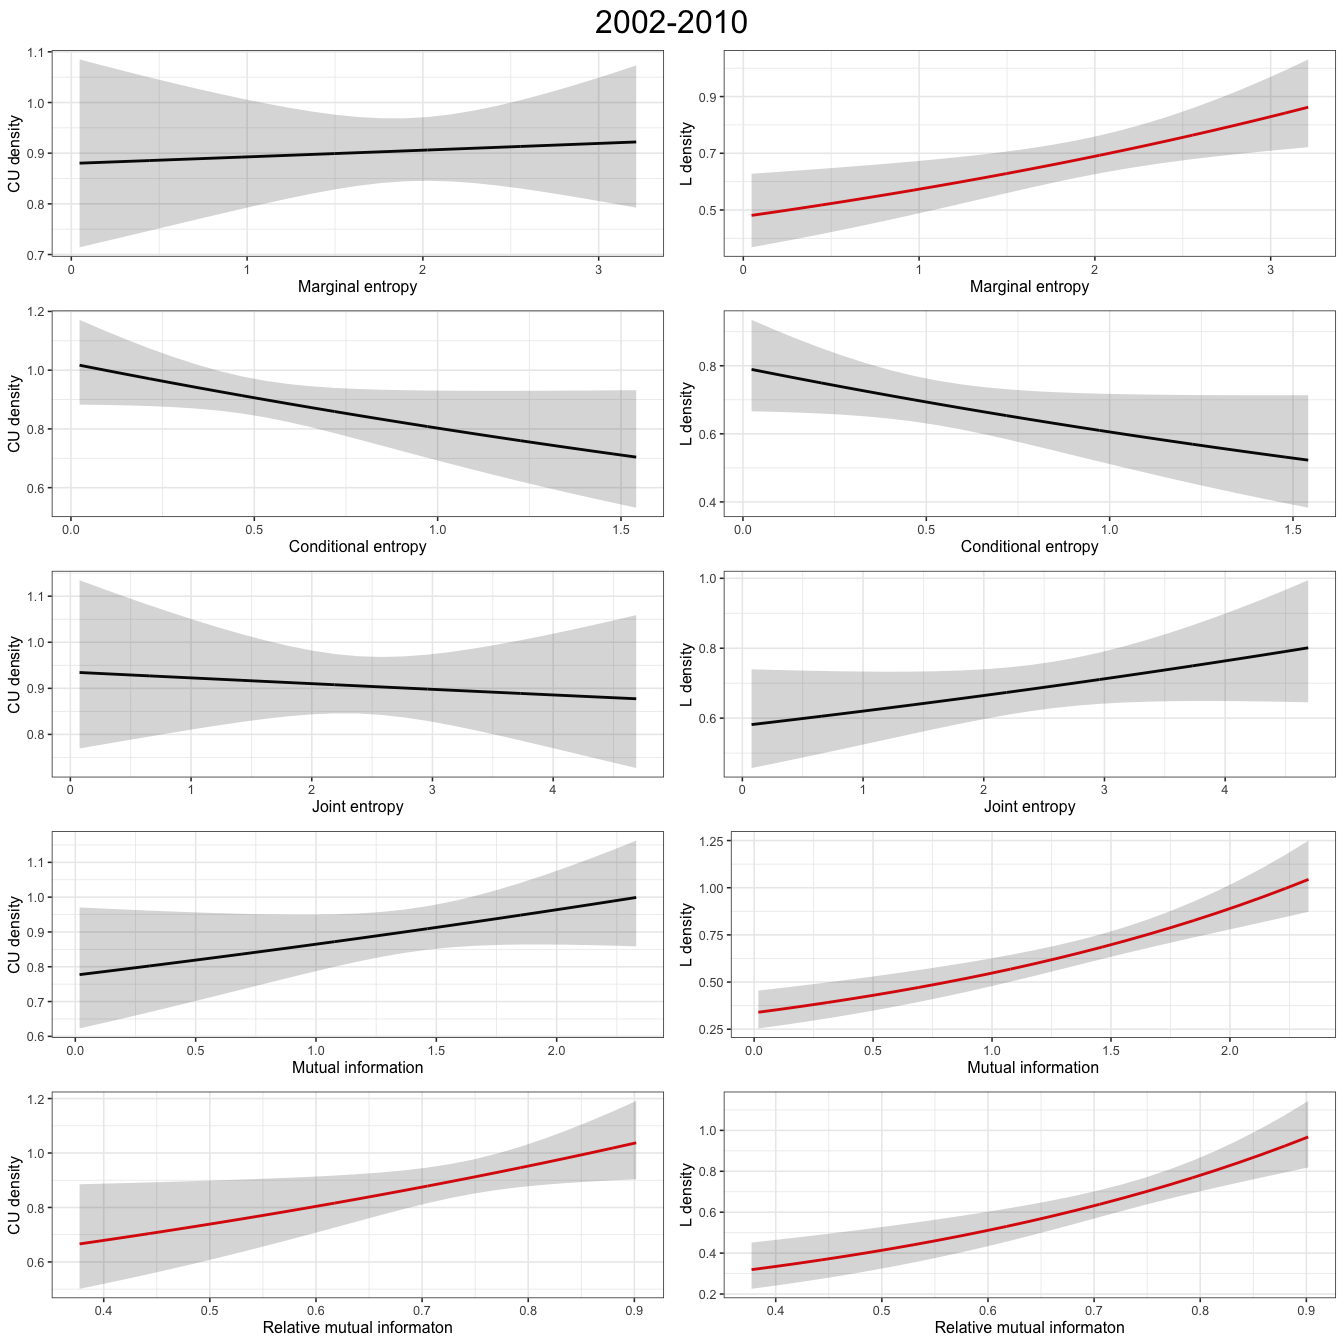
Figure G.1: Plots show abundance response to information theory covariates for a GAM
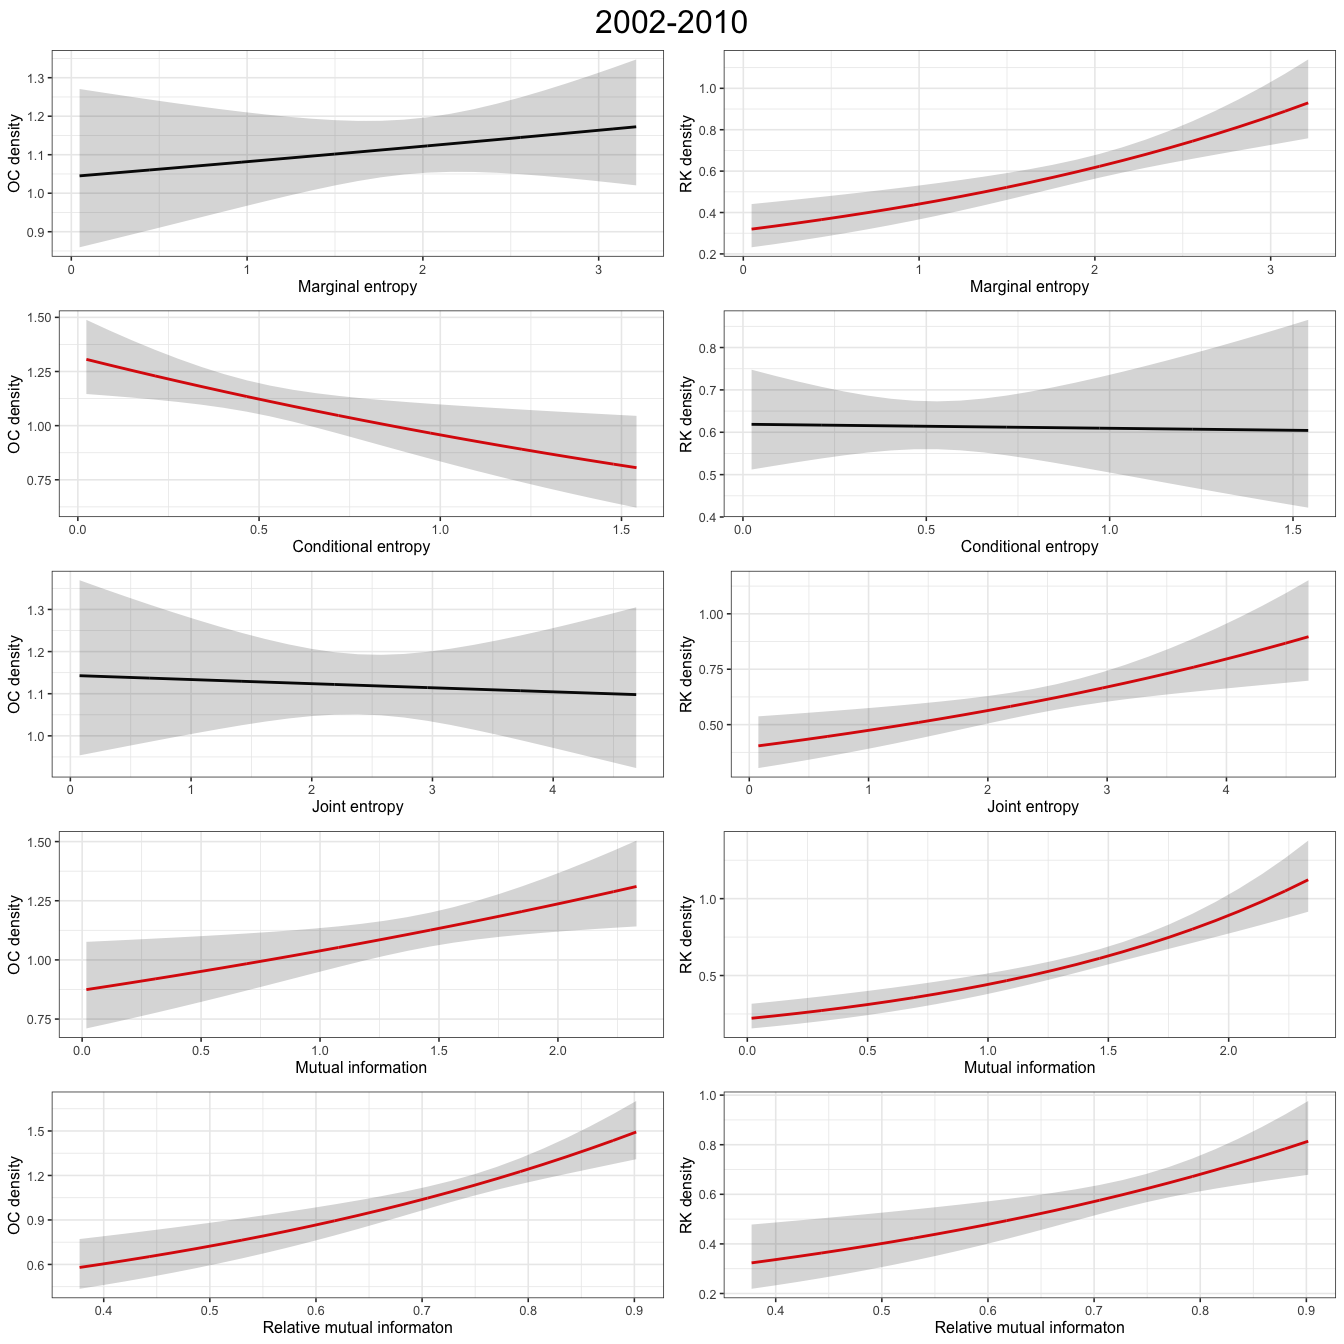
Figure G.2: Plots show abundance response to information theory covariates for a GAM
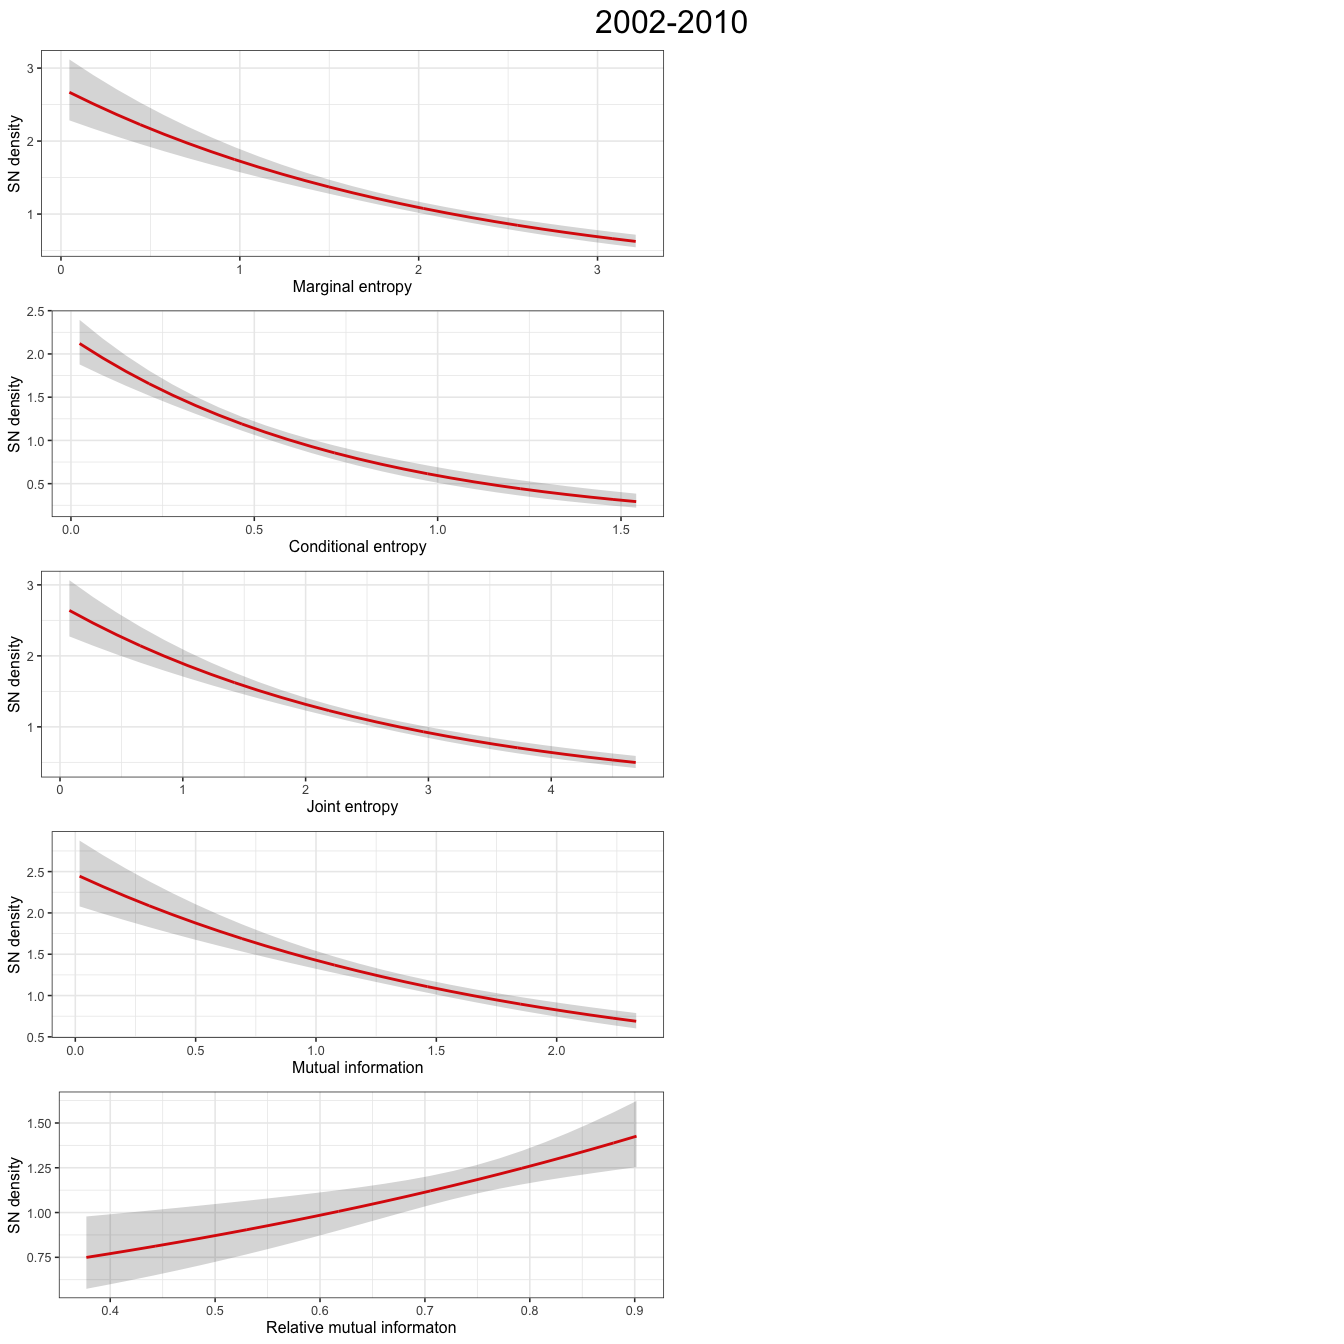
Figure G.3: Plots show abundance response to information theory covariates for a GAM
##
## [[2]]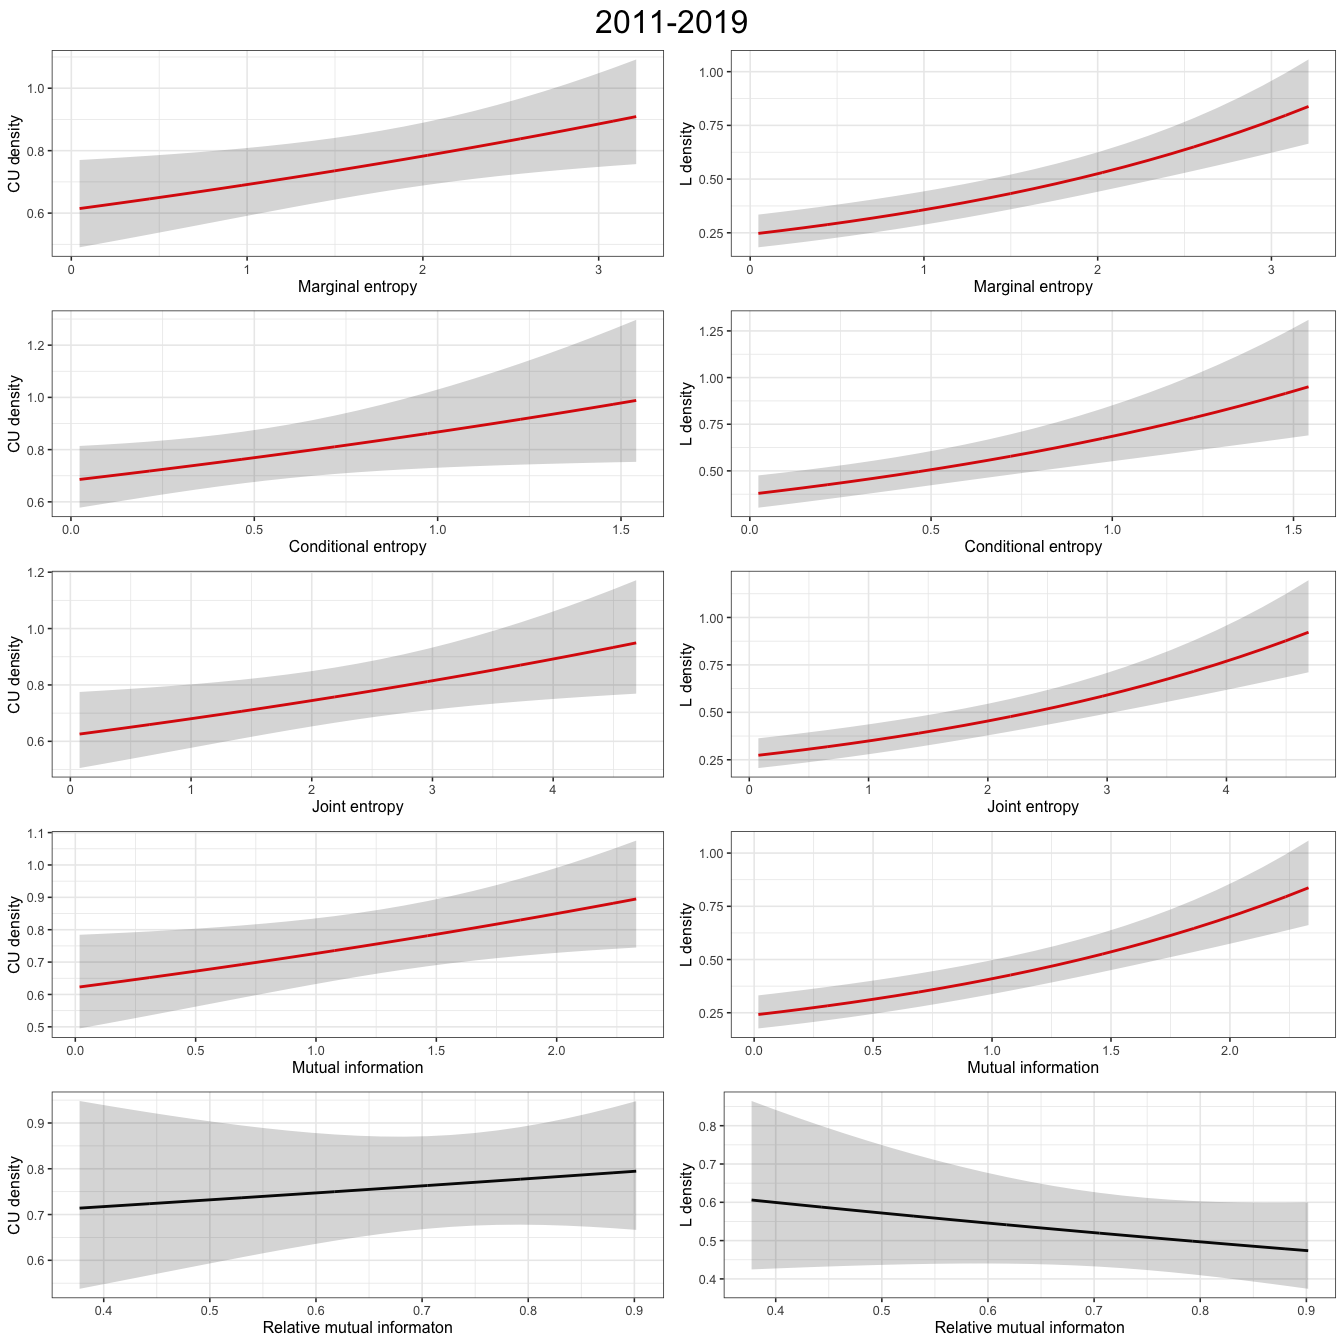
Figure G.4: Plots show abundance response to information theory covariates for a GAM
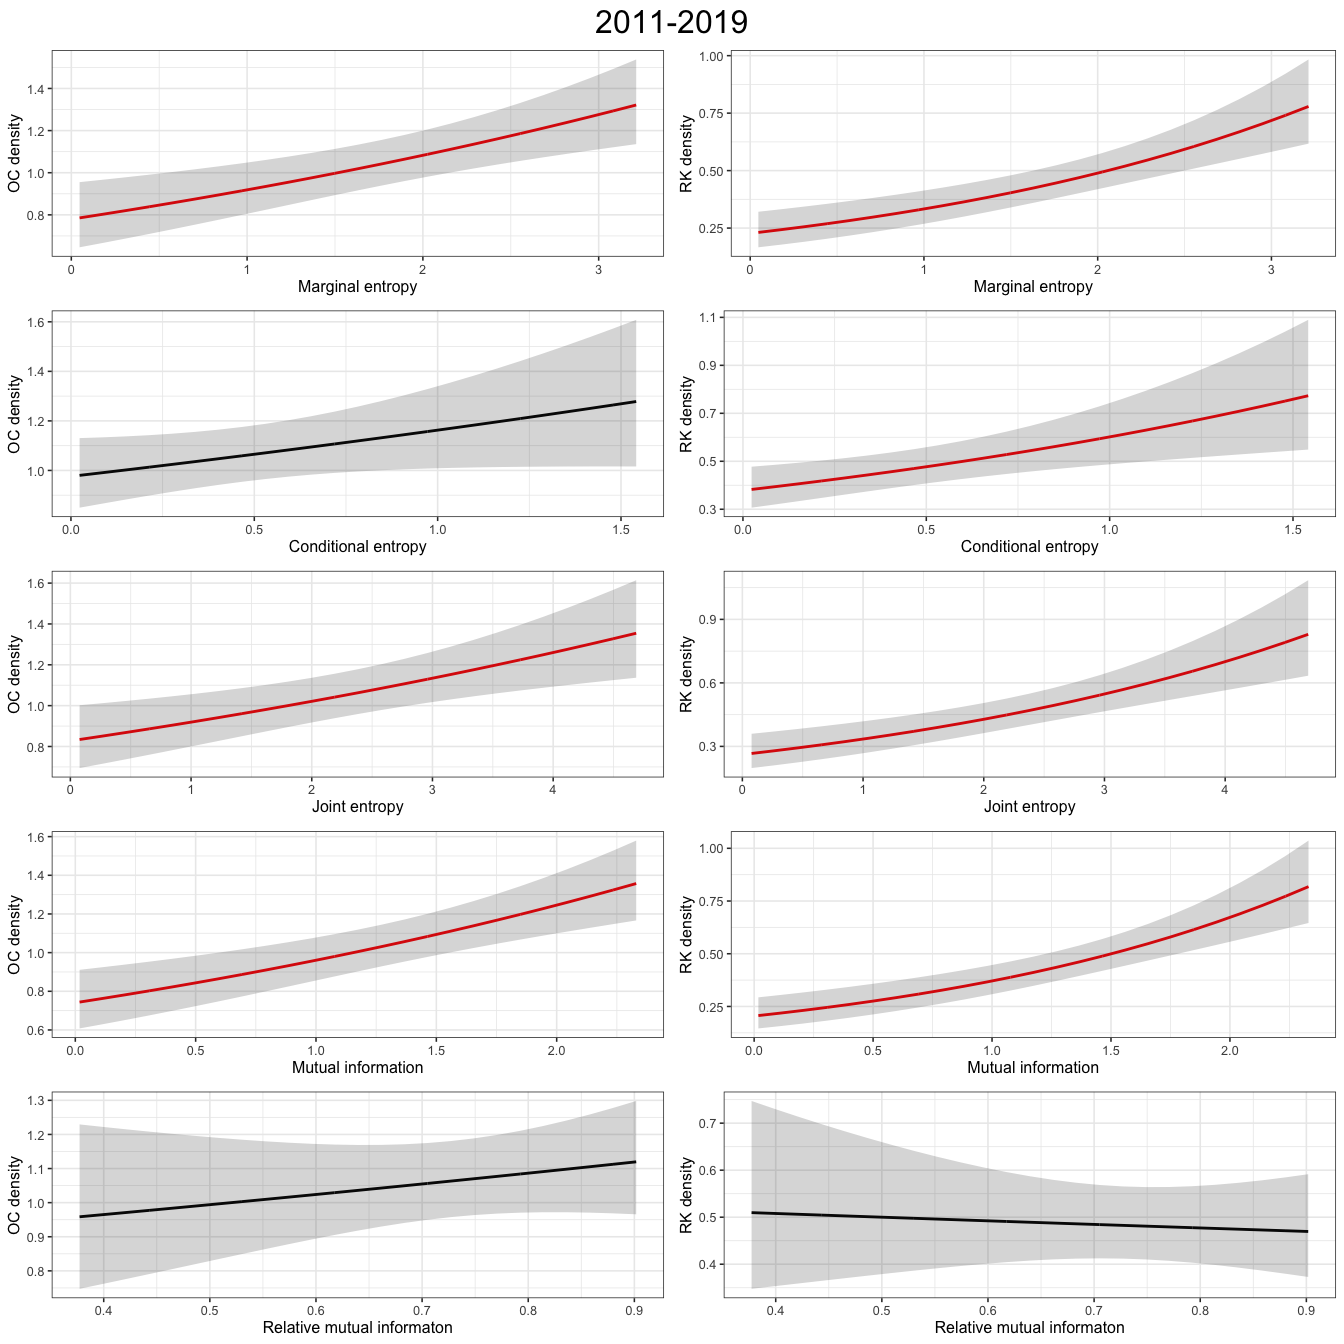
Figure G.5: Plots show abundance response to information theory covariates for a GAM
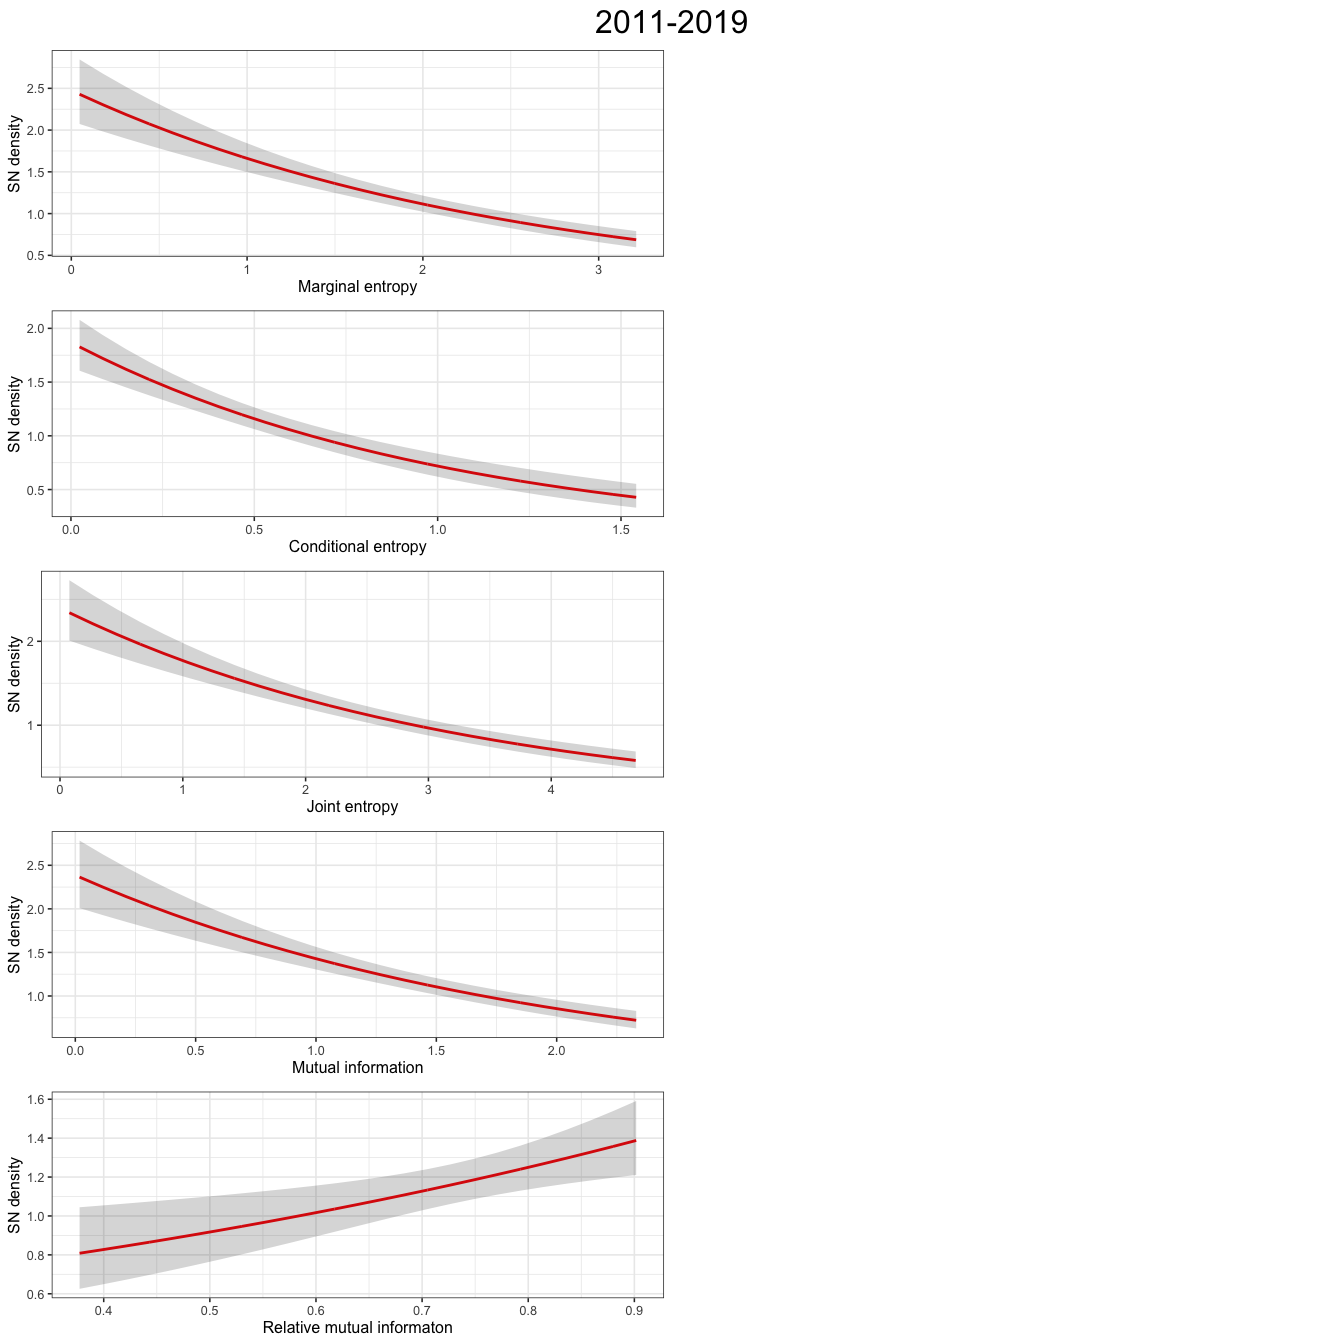
Figure G.6: Plots show abundance response to information theory covariates for a GAM