C Plots for GAM abundance response model
## [[1]]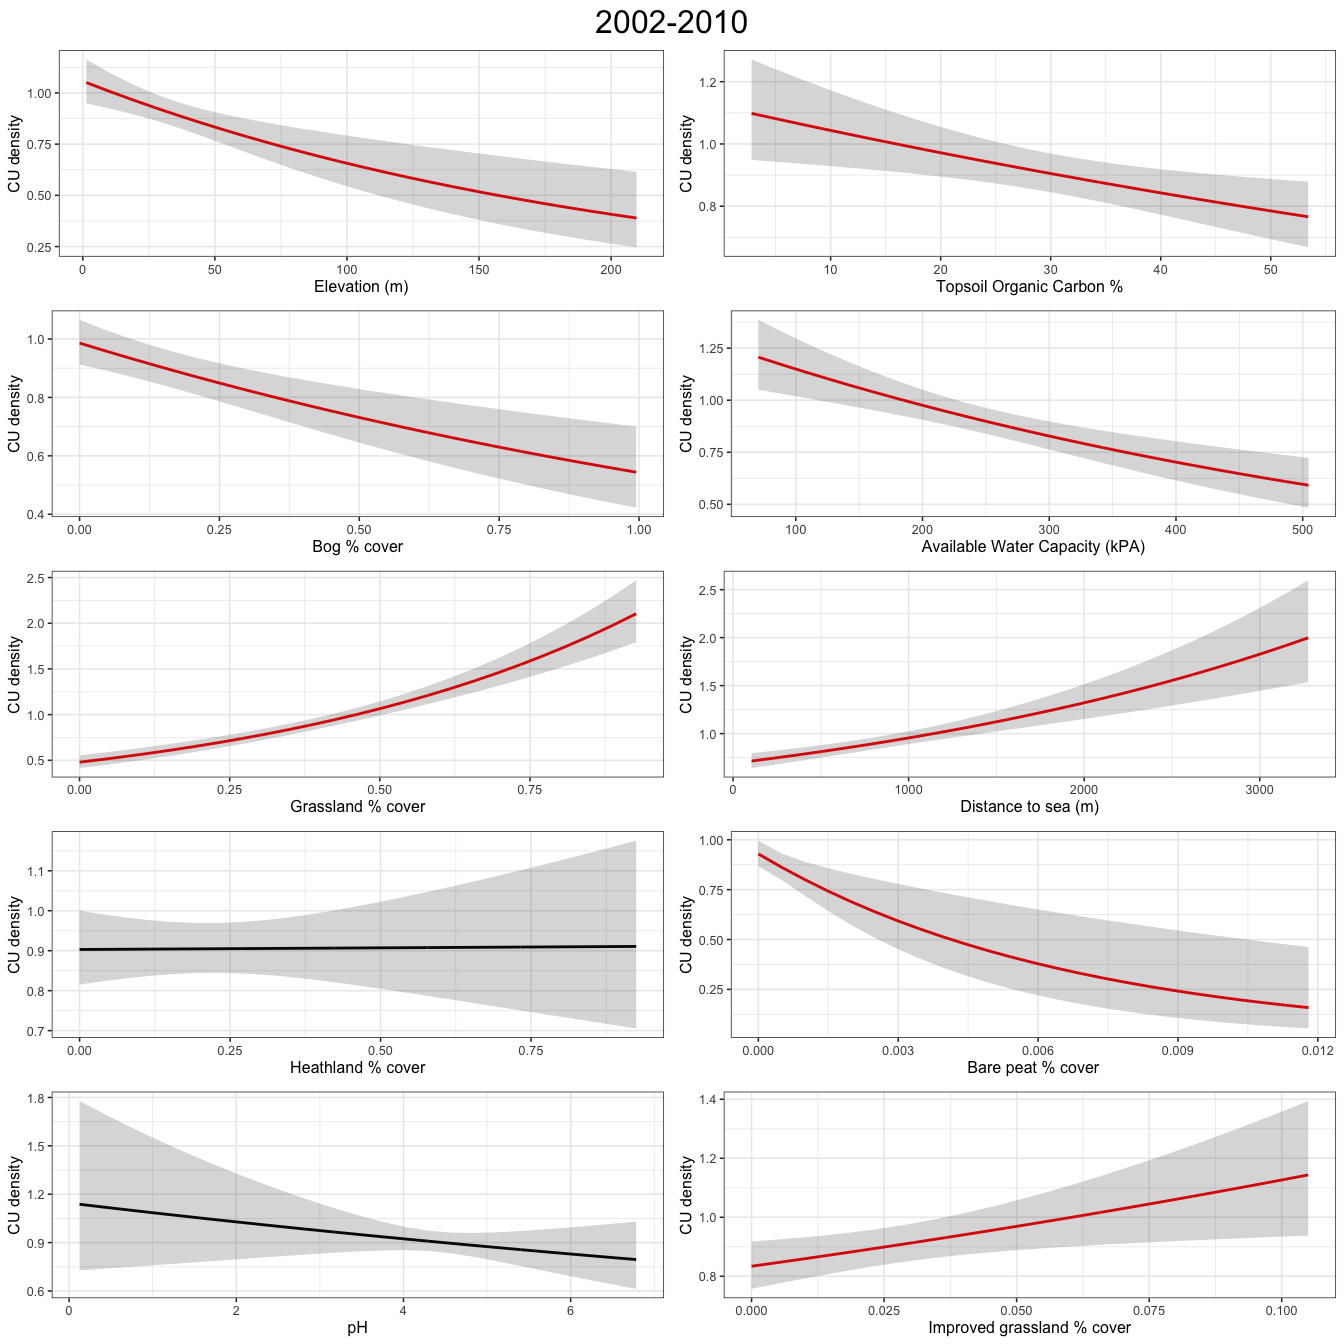
Figure C.1: Plots show abundance response to environmental covariates for a GAM
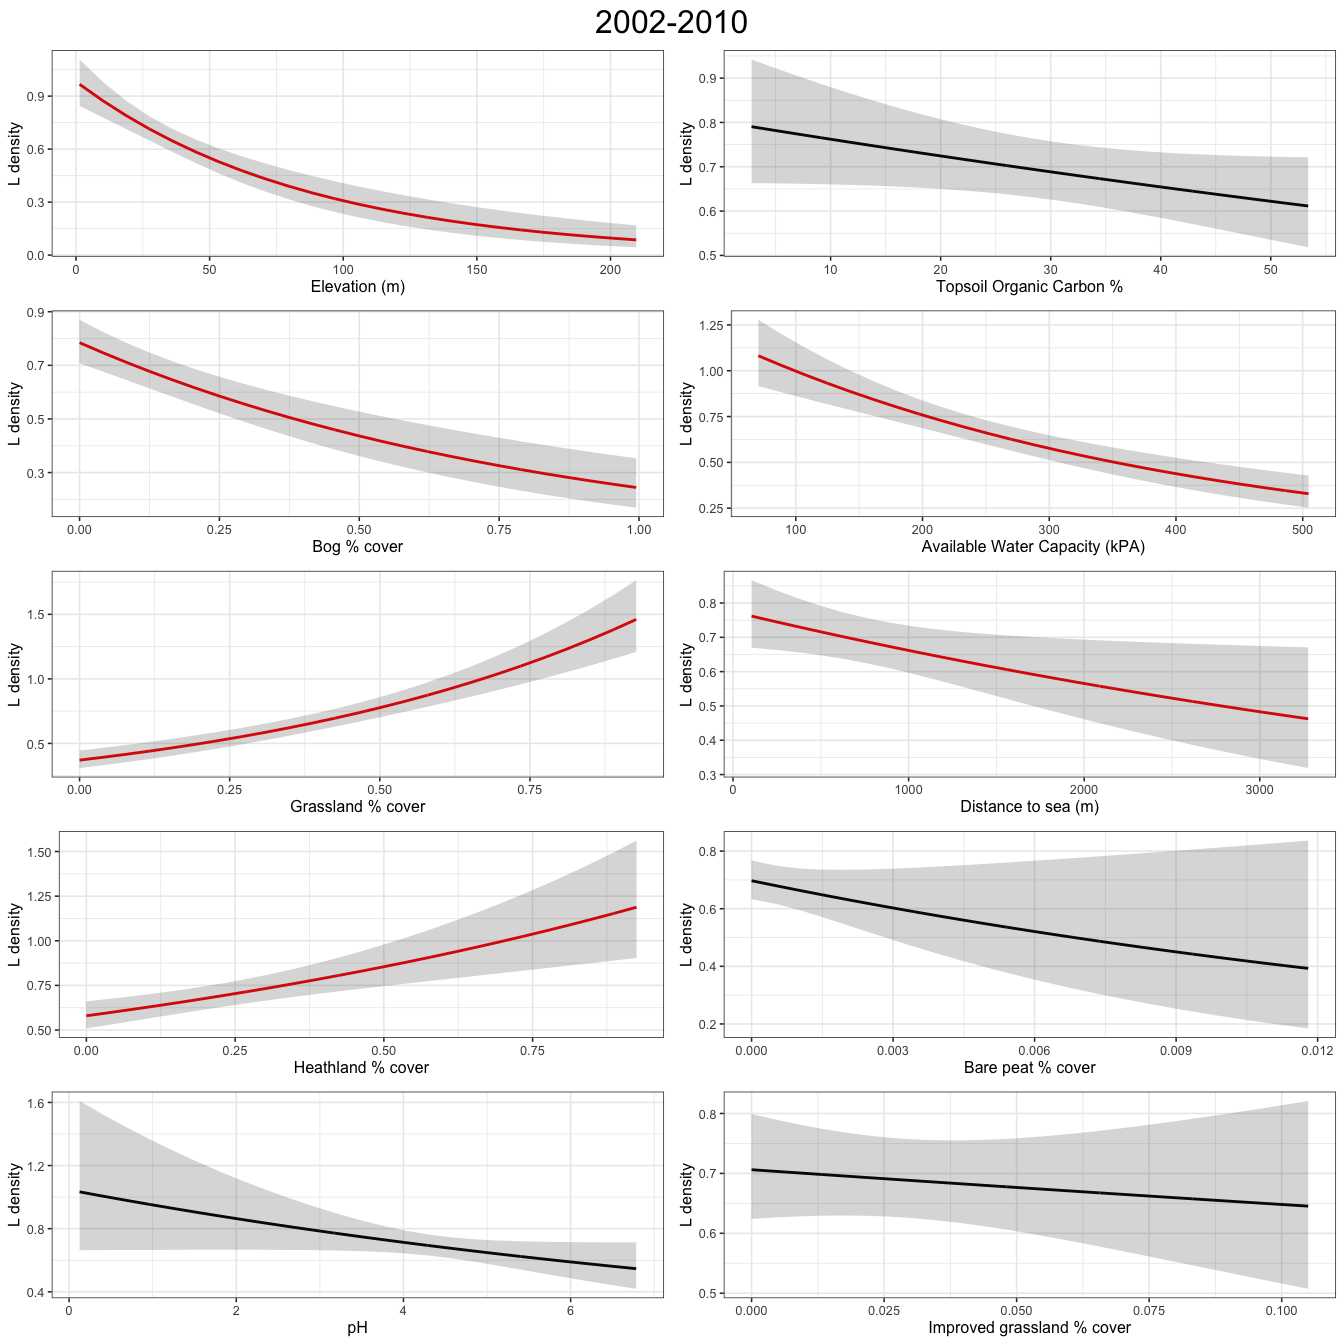
Figure C.2: Plots show abundance response to environmental covariates for a GAM
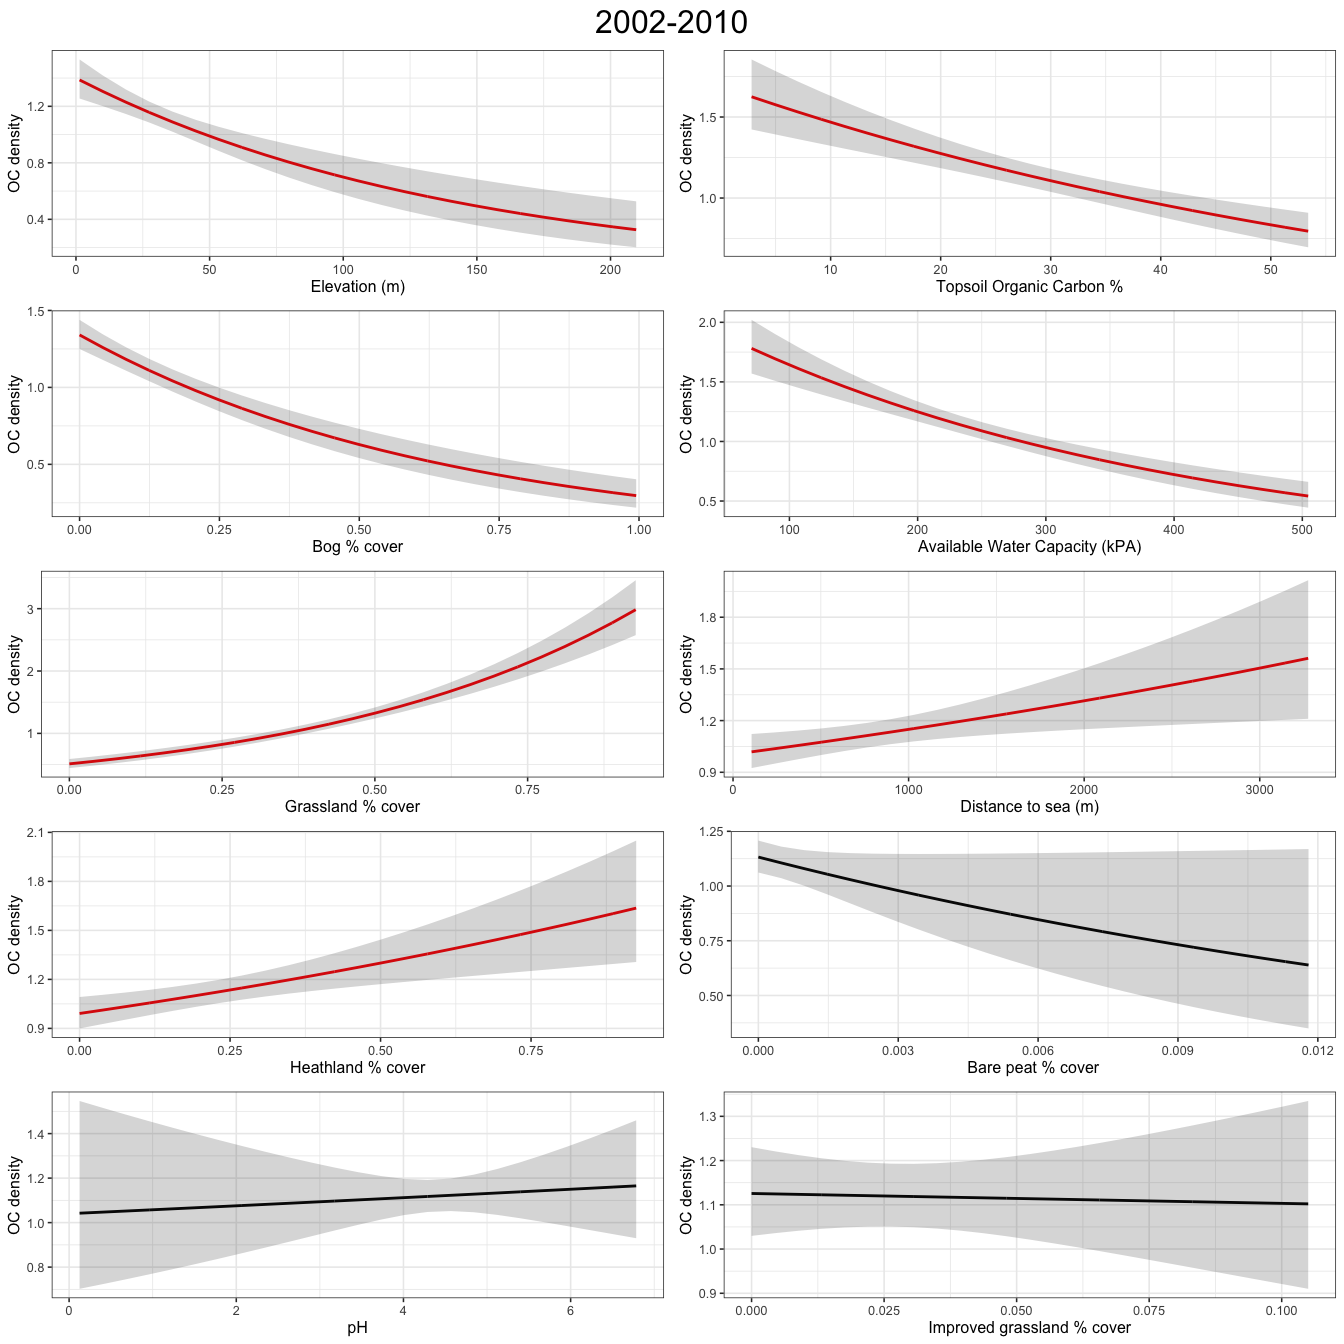
Figure C.3: Plots show abundance response to environmental covariates for a GAM
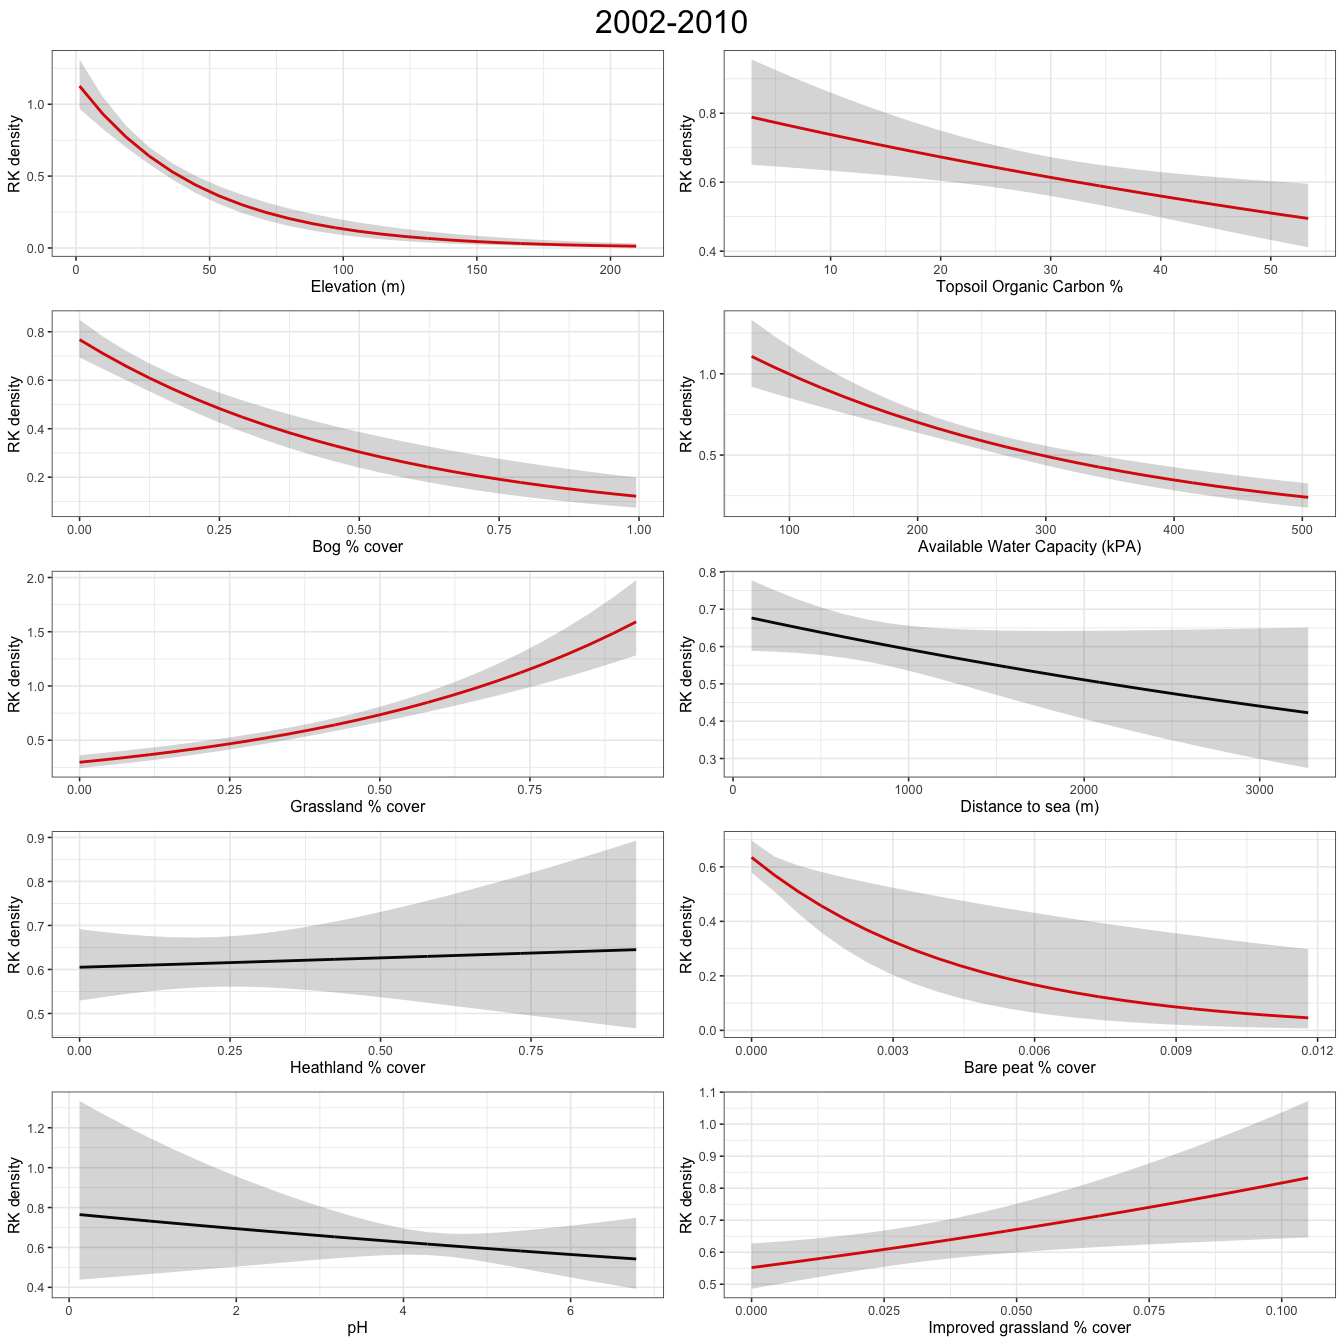
Figure C.4: Plots show abundance response to environmental covariates for a GAM
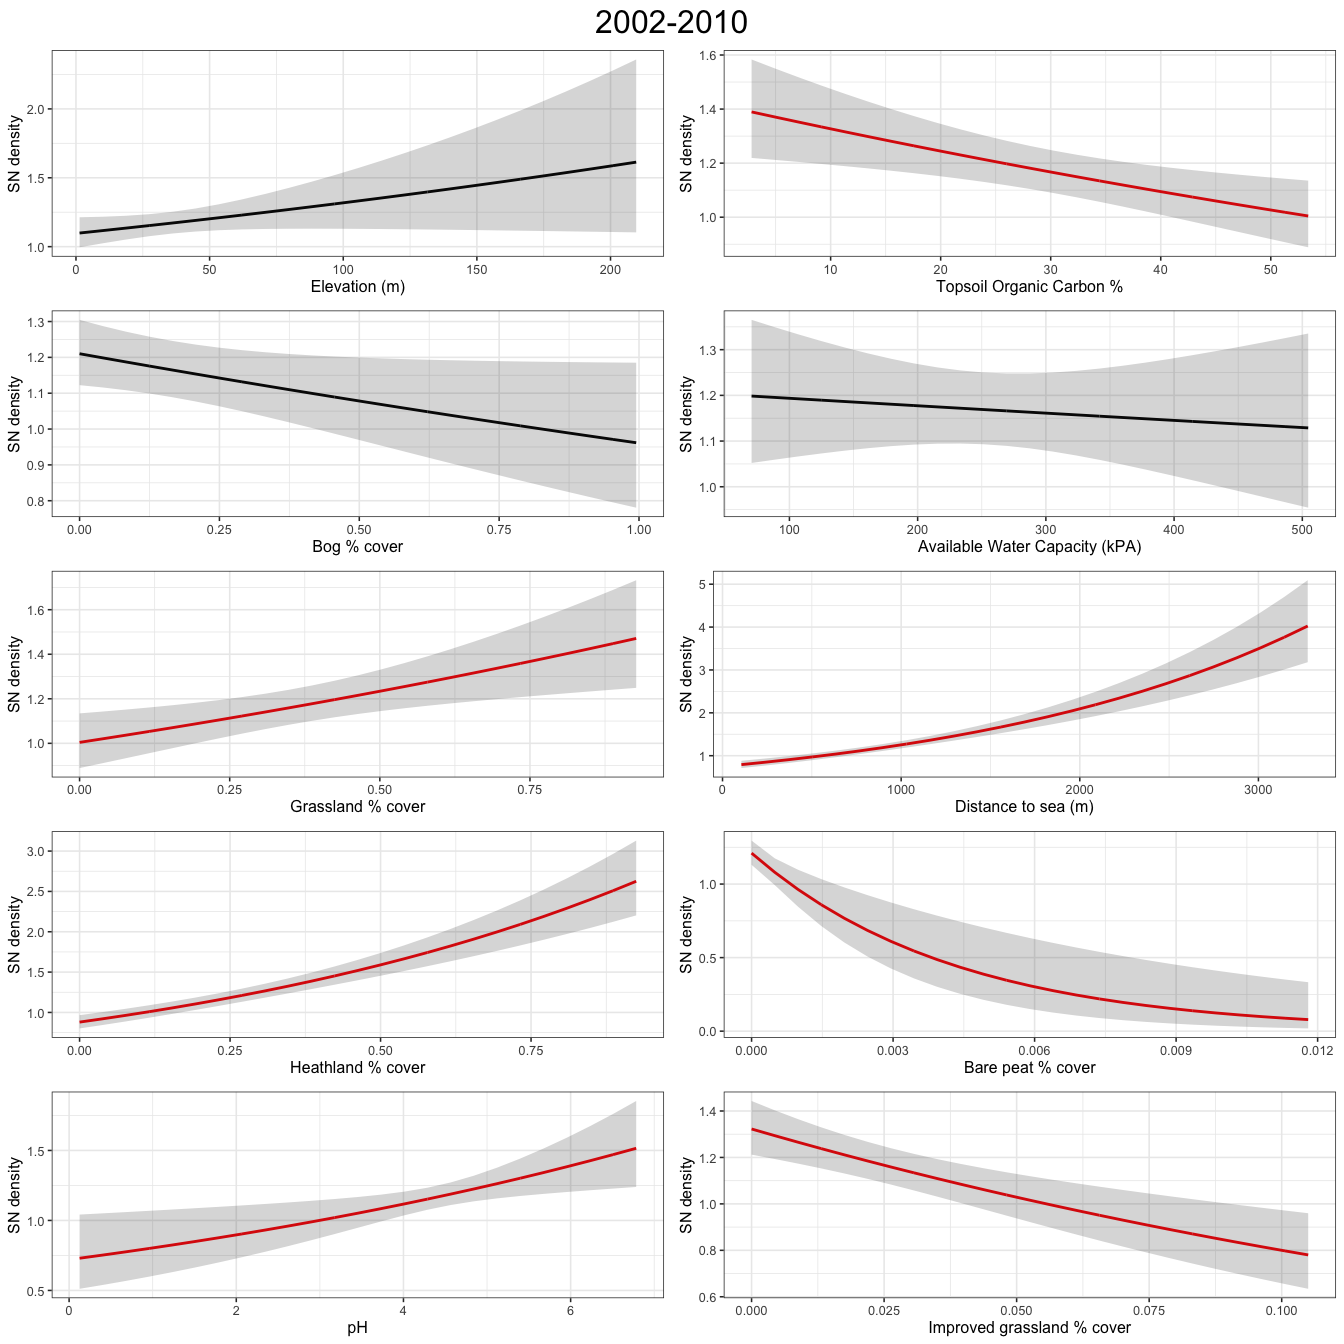
Figure C.5: Plots show abundance response to environmental covariates for a GAM
##
## [[2]]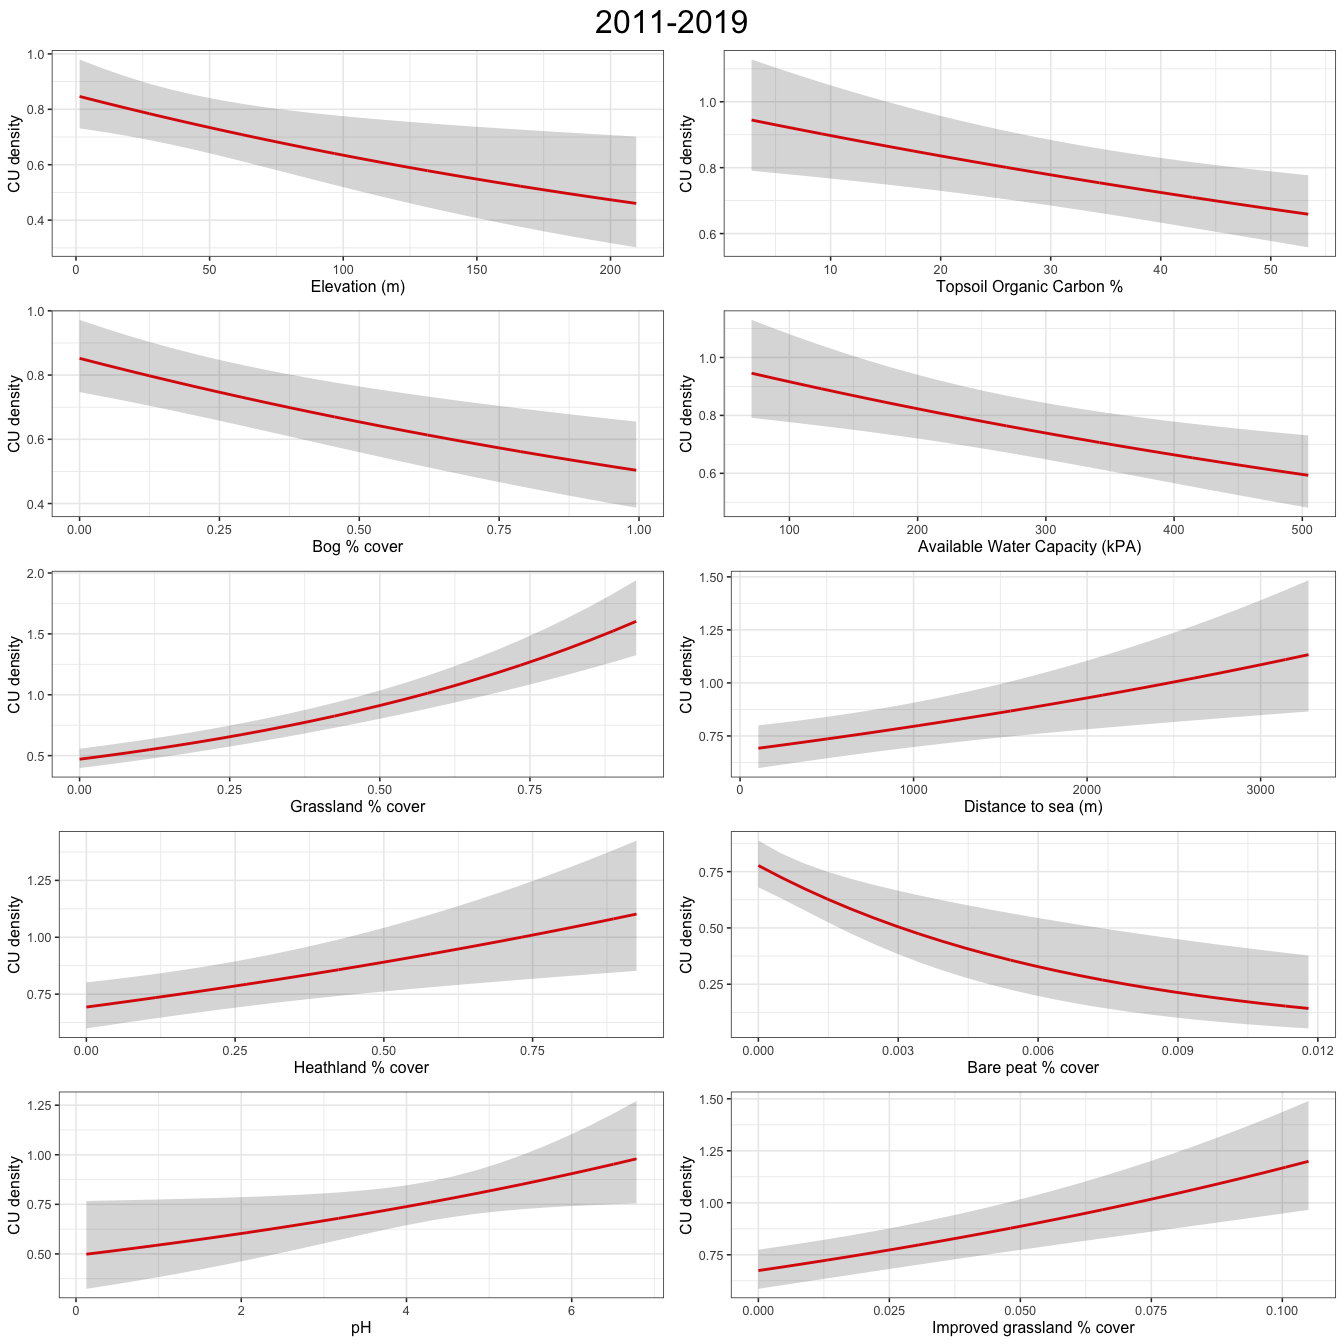
Figure C.6: Plots show abundance response to environmental covariates for a GAM
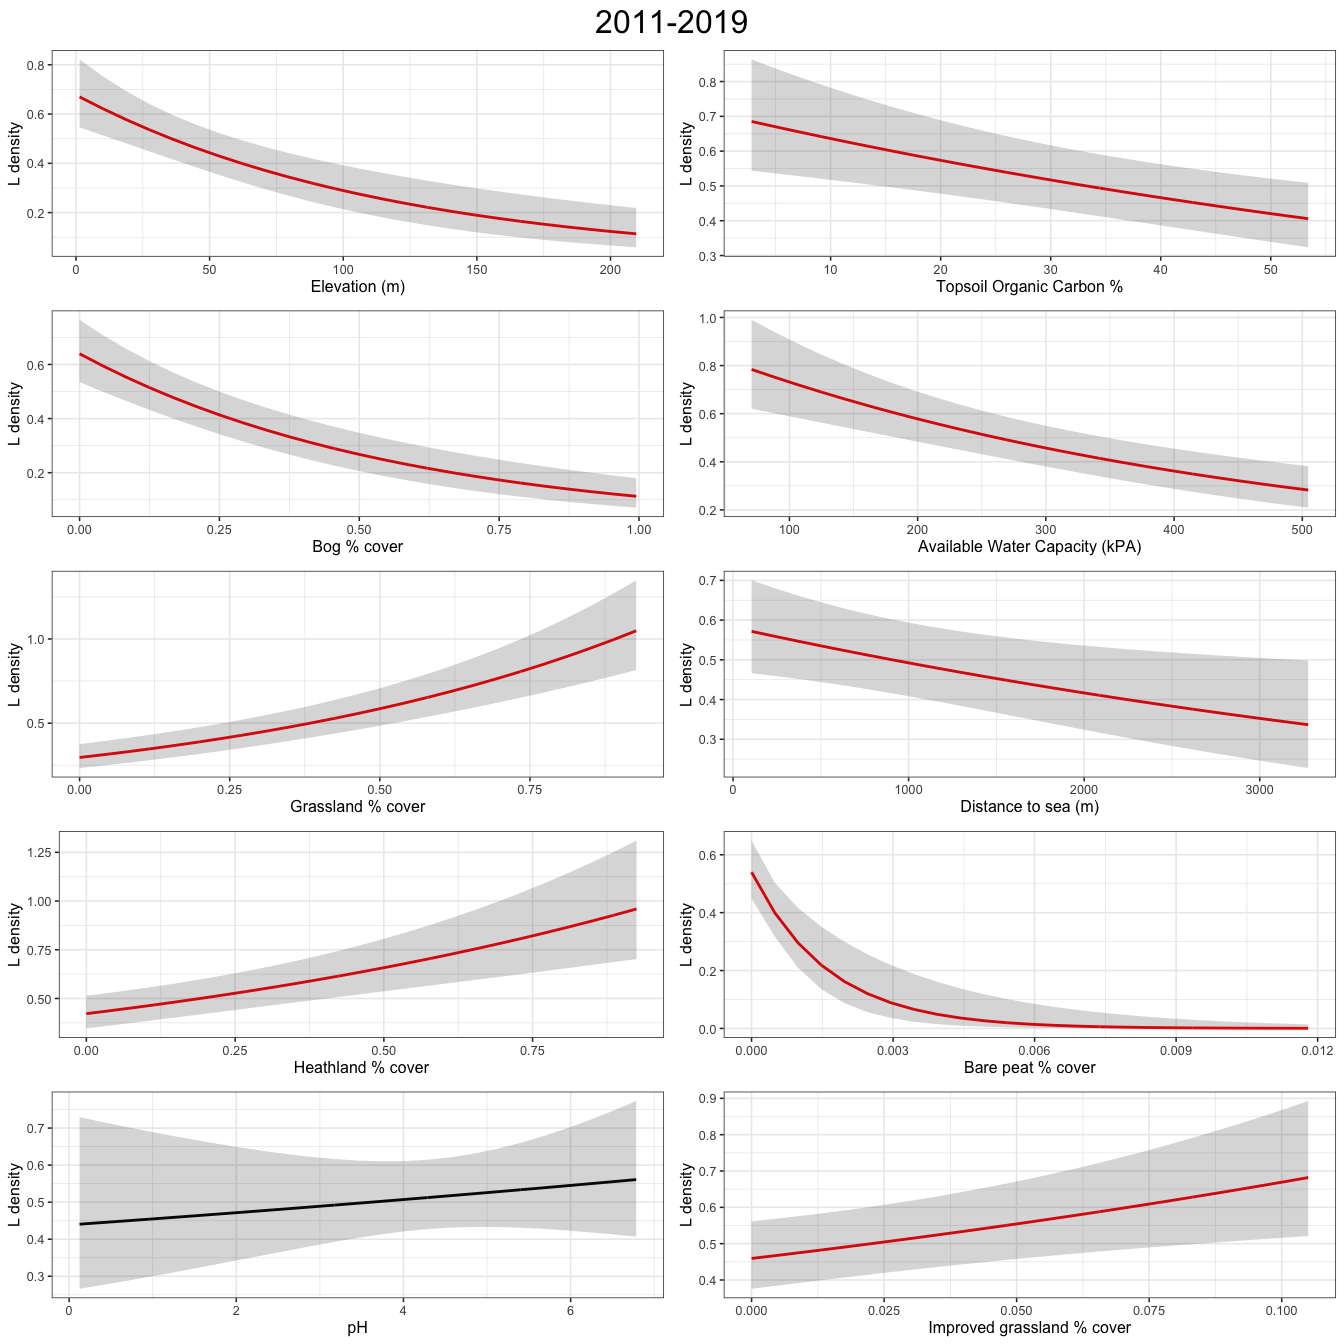
Figure C.7: Plots show abundance response to environmental covariates for a GAM
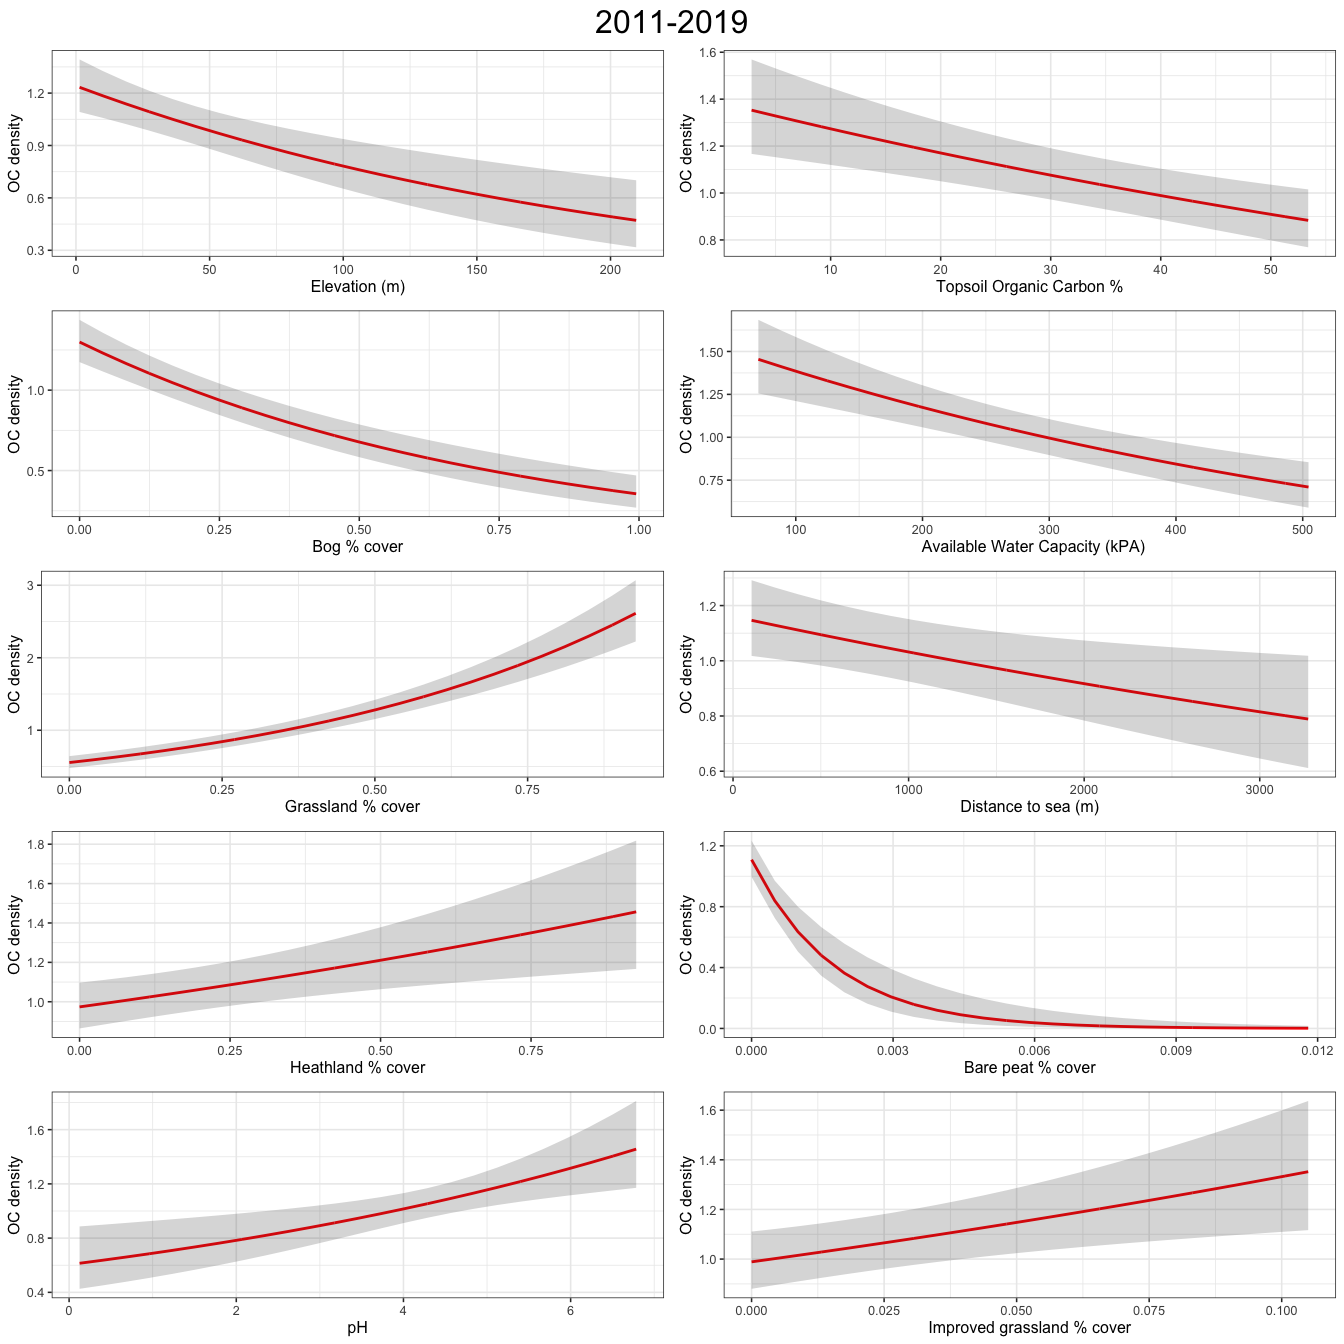
Figure C.8: Plots show abundance response to environmental covariates for a GAM
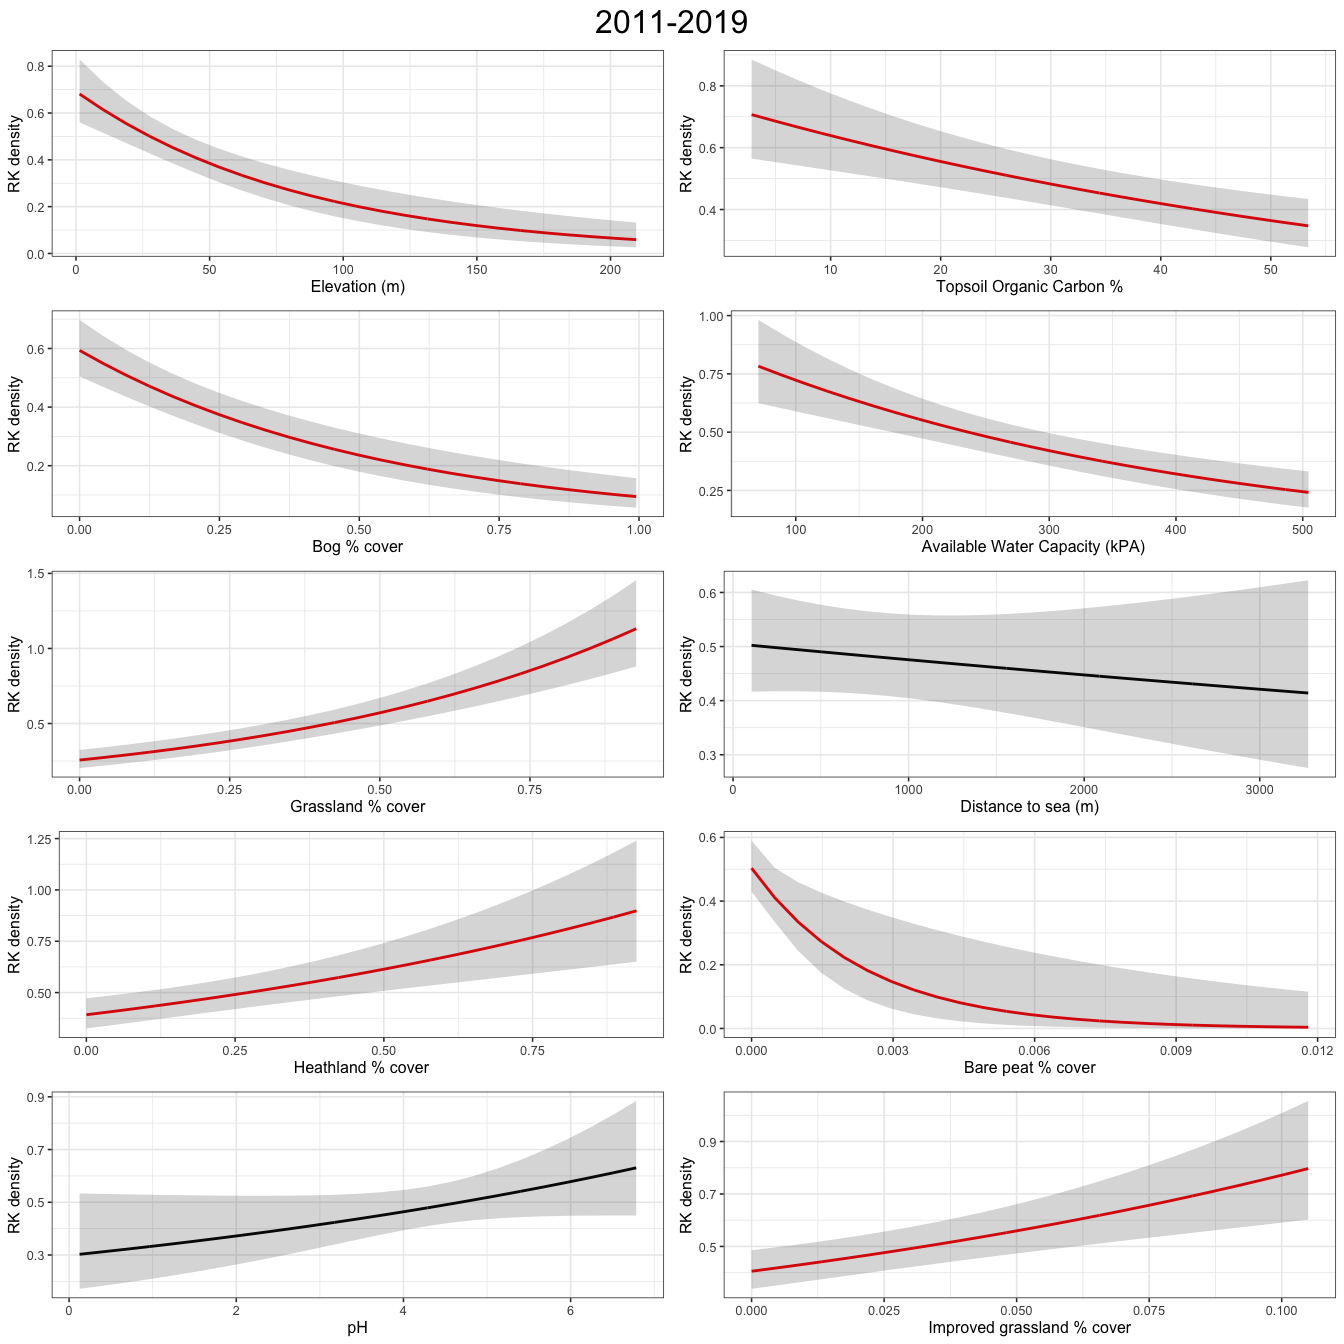
Figure C.9: Plots show abundance response to environmental covariates for a GAM
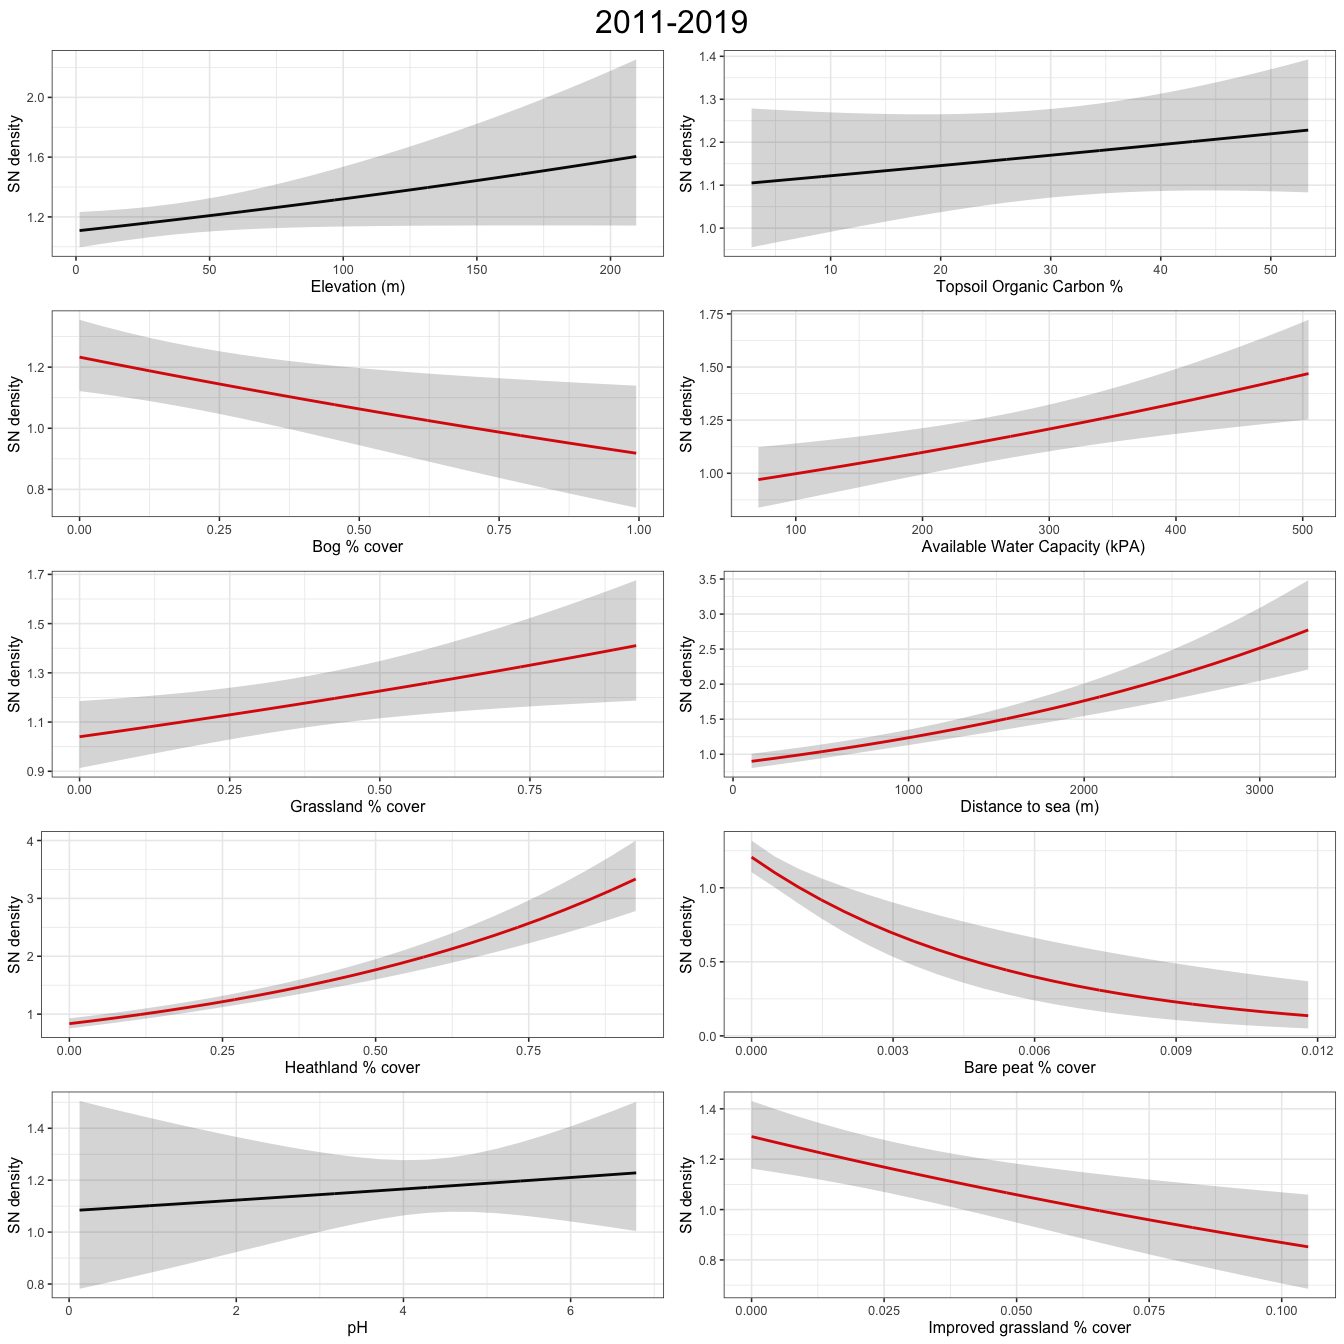
Figure C.10: Plots show abundance response to environmental covariates for a GAM