4 Discussion
The results indicate there are a number of statistically significant associations between breeding wader abundance and the various covariates outlined in the hypotheses in the introduction in Section 1.6. Figure 4.1 summarises the results against each of these hypotheses. If the results were in agreement across both analysis periods they are marked as strongly supported (SS) and if only in one period partially support (PS). If the hypothesis is not supported by the results at all, or it is not statistically significant, then it is marked as not supported (NS).
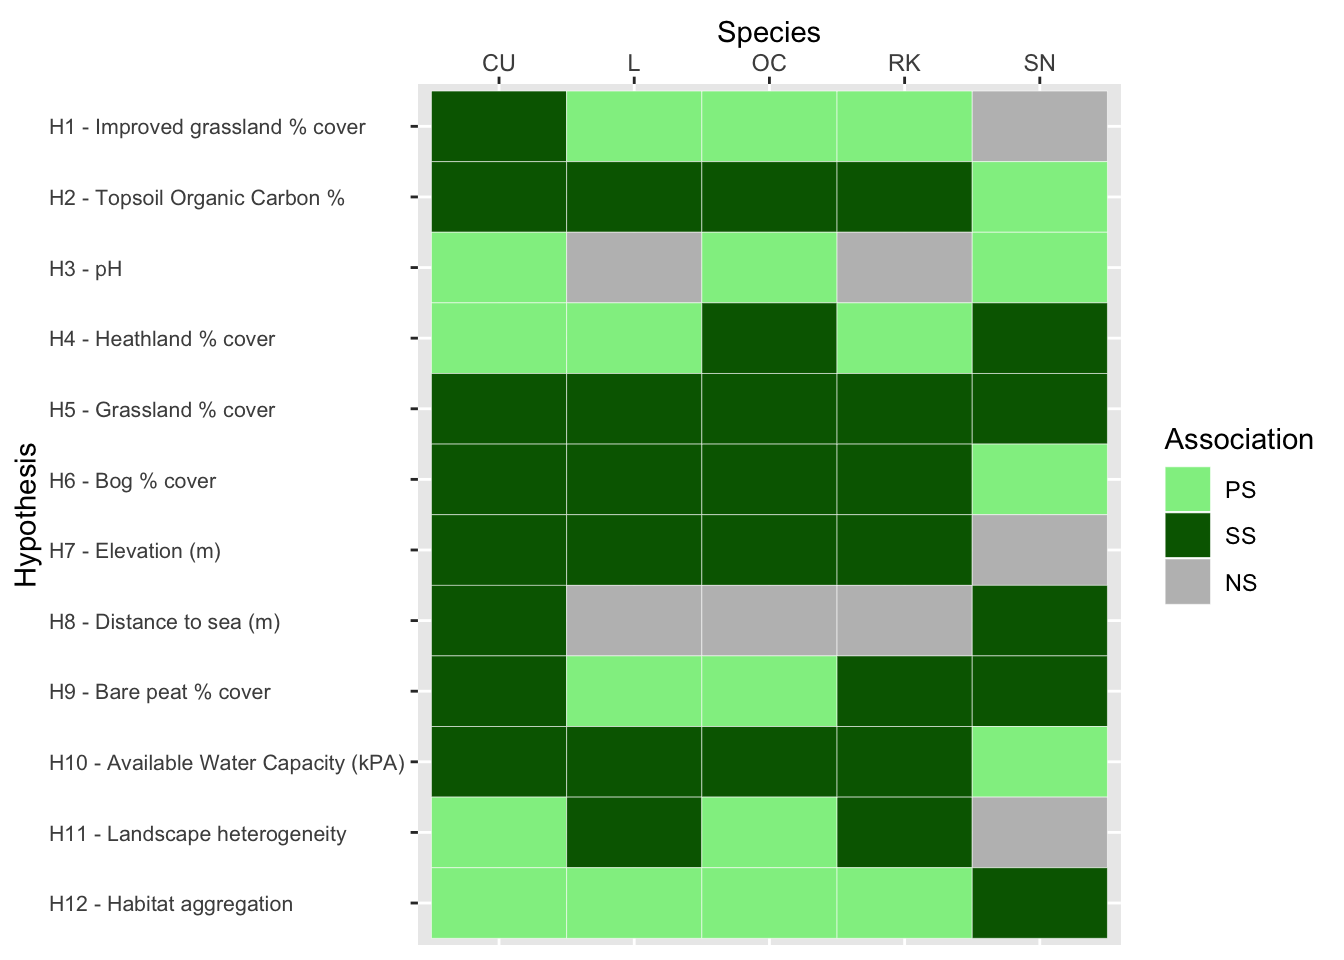
Figure 4.1: Summary of support for hypotheses made in the introduction, for associations between breeding wader density and environmental covariates, between 2002 and 2019 inclusive
4.1 Discussion of evidence for each hypothesis
4.1.1 Improved grassland coverage (H1)
In the 1980-90s agricultural subsidies encouraged the farming of high numbers of upland sheep (Shetland Islands Council 2016), which in turn supported the “improvement” of marginal in-bye grassland so as to produce silage as a winter feed for sheep. Improved fields were also treated with lime and fertiliser so as to artificially boost yields of grass for silage. The practise of rotating re-seeded improved grassland and a spring-sown crop is not widely undertaken in Shetland any longer. The area of ground in cultivation for crops (excluding improved grassland) in Shetland fell by 90% between 1971 and 2008 (Shetland Islands Council 2016). This change in agricultural practice has meant that the majority of grassland sward has become permanent, and due to ongoing sheep grazing is therefore likely to be uniform in structure. The practise of annual fertilising and liming will increase pH which is good for invertebrate abundance, but fast growing and uniform sward, ready to cut in the early summer before the end of the wader nesting season, may not be ideal for breeding waders.
The 2002-2010 analysis period for improved grassland is positively associated with Curlew and Redshank, and negatively associated with Snipe. The second analysis period from 2011-2019 has improved grassland positively associated with all wader species, apart from Snipe which is again negatively associated. The second analysis period validates the hypothesis that there is a positive association between breeding wader density and improved grassland, whilst the first analysis period partially supports this. Snipe are known to breed in dense vegetation, marshes and bogs (Robinson 2005) and the results agree with this, in that their abundance response is negatively associated with improved grassland in both analysis periods.
For Lapwing and Oystercatcher, the population change ratio between 2002 and 2019 in Figure ?? was positively associated with increased improved grassland coverage and this agrees with the literature (Dallimer et al. 2010; Bell and Calladine 2017), in that population densities appear stable or increasing on low intensity improved grassland. However Figure 3.28 clearly shows that between 2002 and 2019 Lapwing abundance have declined significantly in the south west mainland, where improved grassland is mostly located. The results in Section 3.8.5 suggest that Lapwing populations are strongly associated with the overall size of reseeded improved grassland in Shetland. The reduction in sheep headage in Shetland (Shetland Islands Council 2016) could be driving the reduced acreage of reseeded improved grassland over this period. The reduction in spring-sown crops and improved grassland together with lower natural food availability in the upland habitat of Shetland, could have driven the overall declining Oystercatcher and Lapwing populations to increased densities in the remaining improved grassland habitat, due to greater availability of food to feed chicks. Mccallum et al observed this phenomenon in their paper:
“Lapwing distribution is being constrained between intensively managed lowland farmland with favourable soil conditions and upland sites where lower management intensity favours Lapwings but edaphic conditions limit their distribution” (McCallum et al. 2018)
Current agricultural practices on the more intensively-managed improved grasslands may be incompatible with successful Lapwing and Oystercatcher breeding. For example, fast growing grass intended for silage may not provide the open view that Lapwing require throughout their nesting period, which could lead to nest abandonment.
4.1.2 Topsoil organic carbon content (H2)
Peat rich soils have an organic carbon content >40% by weight (McCallum et al. 2016). Figure 3.13 shows that this is the case for the majority of Shetland soils. A higher organic content is associated with greater soil acidity, which in turn leads to a lower earthworm abundance (McCallum et al. 2018) than in less acidic soils.
Both analysis periods from 2002 to 2019 have strong support for the hypothesis that topsoil organic carbon content is negatively associated with breeding wader abundance. The only exception is for Snipe during 2011-2019 where there was no statistically significant association. In terms of the population change ratio, Snipe population change is positively associated with an increase in topsoil organic carbon content, and Lapwing are not. This is consistent with the literature in that Snipe prefer wetlands which are likely to be acidic bogs that have high organic carbon content, and Lapwing prefer bare fields or short sward grassland that will have relatively low organic carbon content in the topsoil.
4.1.3 pH (H3)
Soil pH together with topsoil organic carbon content, is a key indicator of soil health (McCallum et al. 2016, 2018) as measured by earthworm density, which falls significantly if the soil pH is less than 5.5. As Shetland soils are mostly acidic peatland, especially in upland areas, a significant proportion of soils have a pH below this level (see Figure 3.13). It is therefore likely that peatland areas are negatively associated with earthworm abundance. Improved grassland is typically treated with lime and fertiliser in-order to boost growth, which has the side effect of increasing the pH which in-turn increases earthworm abundance. As such a higher pH would be expected to give a positive association with breeding waders.
The 2002-2010 analysis period for pH has no statistically significant associations with pH, apart from Snipe, which were positively associated. The 2011-2019 analysis period had positive associations for Curlew and Oystercatcher. So it seems that the second analysis period partially supports hypothesis H3, but the 2002-2011 analysis period does not. In terms of the population change ratio, pH is positively associated with Lapwing and Oystercatcher population change, and negatively associated with Snipe which is consistent with the literature. It is possible that Lapwing and Oystercatcher are again nesting in marginal land associated with higher pH, such as rough grassland. Snipe prefer wetlands that are likely to have significant rush vegetation which is typical for a relatively low pH soil.
4.1.4 Heathland percentage coverage (H4)
Farmland in Shetland is currently neither highly intensive nor extensive, and primarily occurs as improved grassland for the purposes of winter animal feed. Wader feeding habitat such as improved grassland or shallow wetland is typically embedded within a mosaic of semi-natural blanket bog, unimproved grassland and heath. Heathland habitat within 500m to 2500m (???) too wetland or improved grassland, makes it ideal for nesting waders such as Curlew, Redshank and Snipe. This is because they can exploit the availability of earthworms and invertebrates too feed their chicks whilst nesting in longer heathland vegetation that gives their nest sites greater protection from predators.
The 2002-2010 analysis period partially supports the hypothesis that heathland is positively associated with all wader species (Figure 3.16), with only Oystercatcher and Snipe having a positive association with increased heath percentage coverage. This is expected for Snipe, but Oystercatcher are expected to nest on improved or rough grassland (Bell and Calladine 2017). The second analysis period from 2011-2019 shows that all breeding waders have a positive association with increased heath coverage per \(km^2\). Thess results together with the result of the population change ratio association for heathland percentage coverage (see Figure 3.18), suggests that non-heathland species such as Lapwing and Redshank are being displaced from their preferred habitats of improved grassland and wetland respectively into heathland, due to changes in habitat over the two analysis periods.
Anecdotal evidence suggests the condition of heathland habitats in Shetland since the late 1990s has improved, due to the disappearance of sheep headage payments that supported very high numbers of sheep in the hills, and the initiation of agri-environment scheme funding for removal of sheep from the uplands where heathland is significant. Greater vegetation cover and low disturbance levels during the breeding season is possibly providing more suitable nesting conditions in the second survey period, leading to a universal positive association between heathland habitat and breeding waders of all species.
4.1.5 Grassland percentage coverage (H5)
Within the EUNIS landcover categorisation dataset, grassland contains improved and semi-natural grasslands and so is quite a broad class of habitat (EUNIS 2019). It was expected that grassland would have a strong association with all breeding wader species due to the presence of both feeding (earthworms and other invertebrates) and nesting sites relatively well hidden in longer sward, and this is the case across both analysis periods. Perhaps more interesting is that Redshank are the only species to have a statistically significant association in the population change model for grassland association. Breeding Redshank population change is negatively associated with grassland percentage coverage (see Figure 3.18).
The reason for this could be that Redshank require a structurally diverse sward, with areas of tall vegetation to hide their nest, and patches of open vegetation and shallow pools for chicks to feed in (Sharps et al. 2016). The maintenance of such conditions relies on grazing practices to create such vegetation diversity, whilst avoiding nest trampling during the breeding season. From an agricultural point of view, suitable redshank habitats are often of poor value and if they have not been agriculturally improved with drainage, they may have become under-grazed leading to habitat which is not suitable for Redshank (Farm Advisory Service 2017). Agri-environment schemes have supported the conservation of wetland and wet grassland, primarily through the exclusion of livestock during the breeding season with a light grazing period in the late summer and autumn to remove the annual growth of vegetation. However, if the weather and ground conditions are unsuitable at the end of the year for livestock grazing, these wetlands may be left ungrazed, creating a dense sward of low value as breeding habitat in the following spring.
4.1.6 Bog percentage coverage (H6)
A significant amount of Shetland is covered in peatland. Healthy peat is relatively acidic due to its permanently water logged state, and so there is unlikely to be a sufficient earthworm supply to support breeding wader populations. The results suggest that this is the case with both analysis periods showing negative association between breeding wader abundance and bog percentage coverage, with the exception of Snipe where association was not statistically significant in the first analysis period. In terms of the population change ratio, it appears that Redshank are positively associated with increased bog percentage coverage (see Figure 3.18). This could be because Redshank prefer a mosaic of wet habitat and grassland when breeding, or it could be that grassland has become less favourable in terms of food availability and so Redshank are nesting in bog habitat as the next best alternative. The population change ratio for Curlew is negatively associated with increased bog percentage landcoverage. This presumably is because nesting Curlew prefer tall vegetation typical of rough grassland and heathland (Franks et al. 2017).
4.1.7 Elevation (H7)
Habitat at higher elevations within Shetland is typically heathland, exposed rock or bog, and heavily exposed to the extremes of a marine sub-arctic climate. As such food supply for breeding waders will be relatively low compared to lowland areas. This hypothesis (H7) is confirmed by the results, which show there is a strongly supported negative association between breeding wader abundance and elevation, except for Snipe, which was not statistically significant (see Figure 3.16). The population change model for elevation has only statistically significant associations for Curlew and Redshank (see Figure 3.18). The fact that breeding Curlew abundance is negatively associated with elevation could again be due to shorter nesting vegetation and availability of earthworms at higher elevations, which are typically peat bog or rock. The Redshank population change is positively associated with bog and heath cover which tend to be significant habitat at higher elevations, and negatively associated with grassland cover. Whilst lowland habitats are less suitable, higher altitude habitats may have become more attractive with reduced sheep grazing.
4.1.8 Distance from the sea (H8)
The results for the distance from the sea to the nest site vary by significantly by species. In the first analysis period Curlew, Oystercatcher and Snipe have positive associations for distance from the sea to nest locations, whilst Lapwing have a negative association and Redshank is not statistically significant. The second analysis period has the same results apart from Oystercatcher which now have a negative association. Those species that show greater nesting abundance at large distances from the coast may be responding to pressure from coastal predators. Shetland has a significant coastal population of Eurasian Otter Lutra lutra (JNCC 2020) and gulls such as the Great black backed gull Larus marinus that may predate wader eggs or chicks. For species that respond negatively to the distance from the sea, Lapwing and Oystercatcher, this may be because their preference is for improved grassland that is predominantly in the south mainland and typically only a few hundred meters from the sea. Snipe breeds in moorland habitats that predominate in at higher elevations that are typically further away from the coast.
The only statistically significant results for the population change model are for Curlew and Oystercatcher, which both show a negative association between population change over the two analysis periods and distance from the sea. This maybe due to changes within inland nesting territories, such as the decline in available food resources over time.
4.1.9 Bare peat percentage coverage (H9)
Shetland has a significant amount of degraded peatland, and a proportion of this is degraded to the point where the thin vegetative top layer of sphagna known as the acrotelm has completely died, leaving the deep acidic and water logged peat store known as the catotelm exposed. The exposed bare peat layer then further degrades overtime. The results for the two analysis periods show that as expected wader breeding abundance is either strongly or partially supported by a negative association with bare peat percentage landcover. This is most likely due to their being very little food resources available and suitable nesting opportunities in such habitat. Although the population change model results show that Redshank are positively associated with this covariate. This could be because bare peatland forms part of upland mosaics that include wetlands and heath, where Redshank are known to nest.
4.1.10 Available water capacity (H10)
Heathland together with unimproved grassland and blanket bog characterises the majority of habitat within the Shetland archipelago. Breeding wader densities in these semi-natural mosaic are found to be consistently higher when surrounding landscapes have more wetland at a proximity ranging from 500m to 2500m, indicating the importance of wetland availability (Jóhannesdóttir et al. 2019). Both analysis periods show that all breeding wader abundance, apart from Snipe, is negatively associated with increasing water capacity of the topsoil. This is contrast to the hypothesis made in the introduction in Section ?? that postulated that wader abundance would increase as available water capacity increases. It appears that whilst all waders have a preference for damp or wet habitat, only Snipe prefer true water logged habitat that is characteristic of the upland wetlands. Although it appears that the population change model shows that Oystercatcher and Redshank are also tending to show a positive association in terms of population change and available water capacity (see Figure 3.18). This association could explain why there have been significant declines of Oystercatcher and Redshank between 2002 and 2019 in the north east of Shetland on the islands of Unst and Fetlar (see Figure 3.28). Here the available water capacity (AWC) in the soil is relatively low (see Appendix ??), due to the serpentine heath in the north east of Shetland. So if the climate is becoming increasingly dry during the breeding season this could be forcing both Oystercather and Redshank too areas with higher AWC, due to the lack of topsoil invertebrates, and hence the decline of these two species from this area of Shetland.
4.1.11 Landcover heterogeneity (H11)
Marginal entropy is a metric to measure the thematic complexity, or heterogeneity of landcover. As postulated in (???) landscapes that have relatively low agricultural productivity and that are farmed at low intensity and extent, often maximise species diversity and resources. As Shetland is characterised by these type of agriculture practices, which in turn are embedded within a semi-natural mosaic of wetland, heath, rough grassland and peat bogs, it is expected that wader breeding abundance is positively associated with increased marginal entropy. There appears to be strong support for this hypothesis across all wader species, except Snipe, in the second analysis period (see Figure 3.22. Mosaic type habitats offer greater availability and proximity of suitable nesting and feeding habitats for adults and chicks. The closer from the nest chicks can feed, the safer. Snipe are negatively associated with increasing marginal entropy and this is likely due to their preference (Farm Advisory Service 2017) for aggregated wetland and moorland habitat when nesting. This exists extensively in Shetland.
4.1.12 Landcover homogeneity (H12)
Relative mutual information seeks to measure the degree of spatial aggregation of habitat classes within the wider landscape it is situated in. It is expected that breeding waders prefer a mosaic of distinct habitats that allow chicks to walk between nesting and feeding habitats, as demonstrated in Section 4.1.11. The hypothesis that waders would negatively respond to increased spatial aggregation of habitat, is not supported by the results. The results suggest a positive association between all wader species and relative mutual information in the first analysis period, and no statistically significant association apart from Snipe, that are positively associated, in the second analysis period. It is expected that Snipe would be positively associated with increasing relative mutual information as they are specialists of aggregated wetland and moorland habitats. Despite the non-conclusive evidence for the two individual analysis periods, the population change model does have statistically significant negative associations for increasing relative mutual information and Lapwing and Oystercatcher population change. This suggests that both these species have shown lower nesting densities when habitat homogeneity increases. It is possible that overtime as sheep headage has reduced, Lapwing and Oystercatcher that were once displaced from their preferred lowland mosaic type habitat (high heterogeneity), are once again returning to it. And in doing so, they are moving out of areas that are associated with high spatial aggregation such as bog and heathland.
4.2 Shetland breeding wader population trends
The results from the Shetland wader population trends show that breeding waders across Shetland have declined, but not nearly as much as those on the UK mainland. The 2015 BTO Breeding Bird Survey (Harris, S.J., Massimino, D., Newson, S E., Eaton, M.A., Marchant, J.H., Balmer, D.E., Noble, D.G., Gillings, S., Procter, D. & Pearce-Higgins, J.W. 2016) estimates that across Britain farmland wader breeding populations between 1995 and 2015 declined -19% for Oystercatcher, -43% for Lapwing, -48% for Curlew, -39% for Redshank.
There have been a number of other historical surveys of breeding farmland waders on Shetland. These typically used Land Capability Classification (Scottish Government 2020) as a proxy for habitat when fitting regression models for estimate breeding wader populations. No other covariates were used. So it would suggest that the regression methodology followed in this study would give more informative results due to the significantly larger number of covariates utilised in estimating abundance. Although it is important to note that the RSPB surveys used a more comprehensive survey methodology (O’Brien and Murray 1998), than the Shetland BBS, whereby three visits were made to each site in order to generate the count numbers. It is therefore probable that the RSPB survey data have greater accuracy than the Shetland BBS Survey. Table 4.1 shows the estimates for each of the various historical surveys, together with the population estimates for the BBS surveys in 2002 and 2019 generated by this study.
| Species | 1987 | 1993 | 1998/99 | 2002ph | 2002 | 2019 |
|---|---|---|---|---|---|---|
| CU | 2800 | 3975 | 2300 | 3409 | 4567 | 4088 |
| L | 2200 | 2600 | 1740 | 2745 | 3474 | 2638 |
| OC | 3700 | 5000 | 3350 | 7350 | 5269 | 4760 |
| RK | 500 | 1185 | 1170 | 1663 | 2390 | 2248 |
| SN | 4000 | 3450 | 1800 | 6182 | 6043 | 7391 |
Notes for each survey:
- 1987 - a complete survey of Shetland in-bye was undertaken by Pete Ellis and Dave Okill (Ellis et al. 2004), this was combined with moorland surveys from 1986.
- 1993 - Paul Gill surveyed randomly selected 1km squares and combined this with the moorland surveys from 1986 (Ellis et al. 2004).
- 1998/99 - Pete Ellis and Andy Fitchet surveyed randomly selected 1km squares as well as known breeding wader areas (Ellis et al. 2004).
- 2002ph - the Shetland BBS was initiated by Paul Harvey, and 49 (non-randomly assigned) 1km squares were surveyed, and forms the basis of this study (Harvey 2002).
The current best estimate used by RSPB Shetland are the 1998/98 estimate, apart from Snipe which is taken as the 1993 survey estimate (Ellis et al. 2004). Due to significant differences in the methodological approach between the historical estimates and those of this study, a like-for-like comparison should be approached with caution. If the RSPB best estimate is taken as the baseline, it seems that compared to the 2019 population estimate of this study, that pairs of breeding waders have increased in number across all species.
Comparing 2019 to 2002 population estimates, it does seems as if there was a general decline in each species, apart from Snipe. The most significant decline appears to be that of the Lapwing. The analysis shown in Figure 3.25 sufggests that Lapwing decline are strongly associated with a reduction in the acreage of reseeded improved grassland. The clear association between declines of lapwing and temporary grassland is statistically significant (p<0.0001) and it suggests that the 24% drop in the Shetland Lapwing population (Table 3.9) could be due to the significant decline of bare spring-sown grassland and tillage. This finding is also suggested as the major cause of Lapwing declines in a 25 year study of a population of farmland breeding waders (Bell and Calladine 2017). Lapwing appear to benefit from agricultural practices that create bare earth or a very short sward (<5cm) every spring, or more generally nesting sites with an open view. It appears that practices over time, driven by agricultural subsidies, have created a grass monoculture of low value to lapwings.
The other significant results from the population estimates of this study is the growth in numbers of Snipe. Snipe breed in dense vegetation in wetlands. Due to the reduction in sheep headage due to the change in agricultural subsidies, upland areas are likely to have benefited from a decrease in grazing intensity. This in-turn might explain the significant increase in the breeding Snipe population. It is also possible that in lowland in-bye habitat, it is possible that Snipe are less sensitive than Redshank (who also need tall vegetation) to undergrazing or abandonment of wetland areas. Snipe are rarely seen in open, short vegetation so are not associated with the more intensively managed grasslands and arable fields.
4.3 The significance of soil health for breeding wader populations
An important area that has arisen through analysing wader densities and population change is the interaction between semi-natural and improved grassland habitats, and how this interaction drives food availability for wader chicks. Research has recently started to focus on understanding the importance of soil health (McCallum et al. 2018, 2016) in creating adequate food supplies for breeding waders. Understanding earthworm and invertebrate density gradients in different habitat types, and any interaction effects between environmental covariates would be beneficial to improving breeding wader populations and is a potential area of future work. There has been some related work (Pansu et al. 2015) whereby environmental-DNA of soil samples was sequenced to make landscape-scale assessments of soil-biodiversity and its drivers.
As the population change model for Lapwing clearly shows in Figure 3.18, their population whilst declining, has increased in density on lowland improved grassland cover. This suggests that lack of available feeding habitat could be driving this particular change in spatial distribution, and constraining Lapwing population numbers. One way of improving feeding habitat in areas where suitable lowland habitat is not available, could be through the application of lime on upland where there is a greater amount of suitable nesting habitats, but where food abundance is not sufficient due to the quality of the soil structure.
4.4 Covariates that were not explored and future work
Vegetation structure - tall dense vegetation containing rushes is not preferred by Lapwing or Oystercatcher, as they require vegetation that gives them a clear line of sight for predators when nesting. However dense and taller vegetation structure is ideal for waders in general as Redshank, Curlew and Snipe can hide their nests in the longer grass and rushes. Recent work (Howison et al. 2018) has focused on developing radar‐based remote sensing technique (Sentinel‐1 C‐band radar) for large‐scale quantification of agricultural land‐use intensity and vegetation, across human‐dominated landscapes. This satellite product could be used to generate an environmental covariate that would allow the investigation of breeding wader abundance as a function of vegetation structure across space.
Predation - there is significant potential for wader nest and chick predation on Shetland. Possible predators include hedgehogs, rats, corvids and coastal predators including otter and gulls. It was not possible to obtain relevant survey data in order to test this hypothesis and remains an important area of possible future survey work and data analysis. There has been research into predation of Storm Petrel in Shetland (León et al. 2006), but nothing in the literature specifically looking at effects on farmland waders.
Weather - changes in weather patterns might also have a significant long term effect on breeding waders on Shetland. For example, very wet spring weather may mean it is not possible for grassland to be reseeded or spring crops, such as barley, to be sown. As discussed previously, this is a key habitat for Lapwing and Oystercatcher. An important piece of future of work would be to examine the impact of future scenarios of climate change. If the wader breeding season has more severe weather, this may significantly affect wader food sources or wader productivity in general.
4.5 Conclusion
This study has tested 12 different hypotheses relating to how environmental factors affect breeding farmland wader abundance. In doing so there are five main results. Firstly, Shetland is, relatively speaking, a strong-hold for farmland waders within the UK. With the exception of Lawing, the other four species have seen stable or marginal declines in population over the last 20 years, and may have increased significantly since the first RSPB surveys in 1987. Secondly, the overall declining Oystercatcher and Lapwing populations appear to have increased densities over time, in the remaining improved grassland habitat. This could be due to greater availability of food to feed chicks on improved grassland, relative to more marginal land at higher altitudes that is suitable for breeding. This result suggests that low intensity agriculture is a factor in the success of breeding wader populations, and that farmers that farm in this way can be important stewards of nature. Thirdly, Redshank appear to be increasing in more marginal habitat such as heathland and bog at high elevations. This displacement overtime from their preferred habitat of wet grasslands with a diverse and tall sward may be due to a lack of heavy grazung at the right time. Fourthly, Snipe appear to be increasding in numbers due to less intensive grazing in their preferred heathland and wetland habitats. Finally, if the climate is indeed becomming less wet during the breeding season, this could be forcing both Oystercather and Redshank too areas with higher available water content, due to the lack of topsoil invertebrates.