I Plots for population change response model with informtion theory covariates
## [[1]]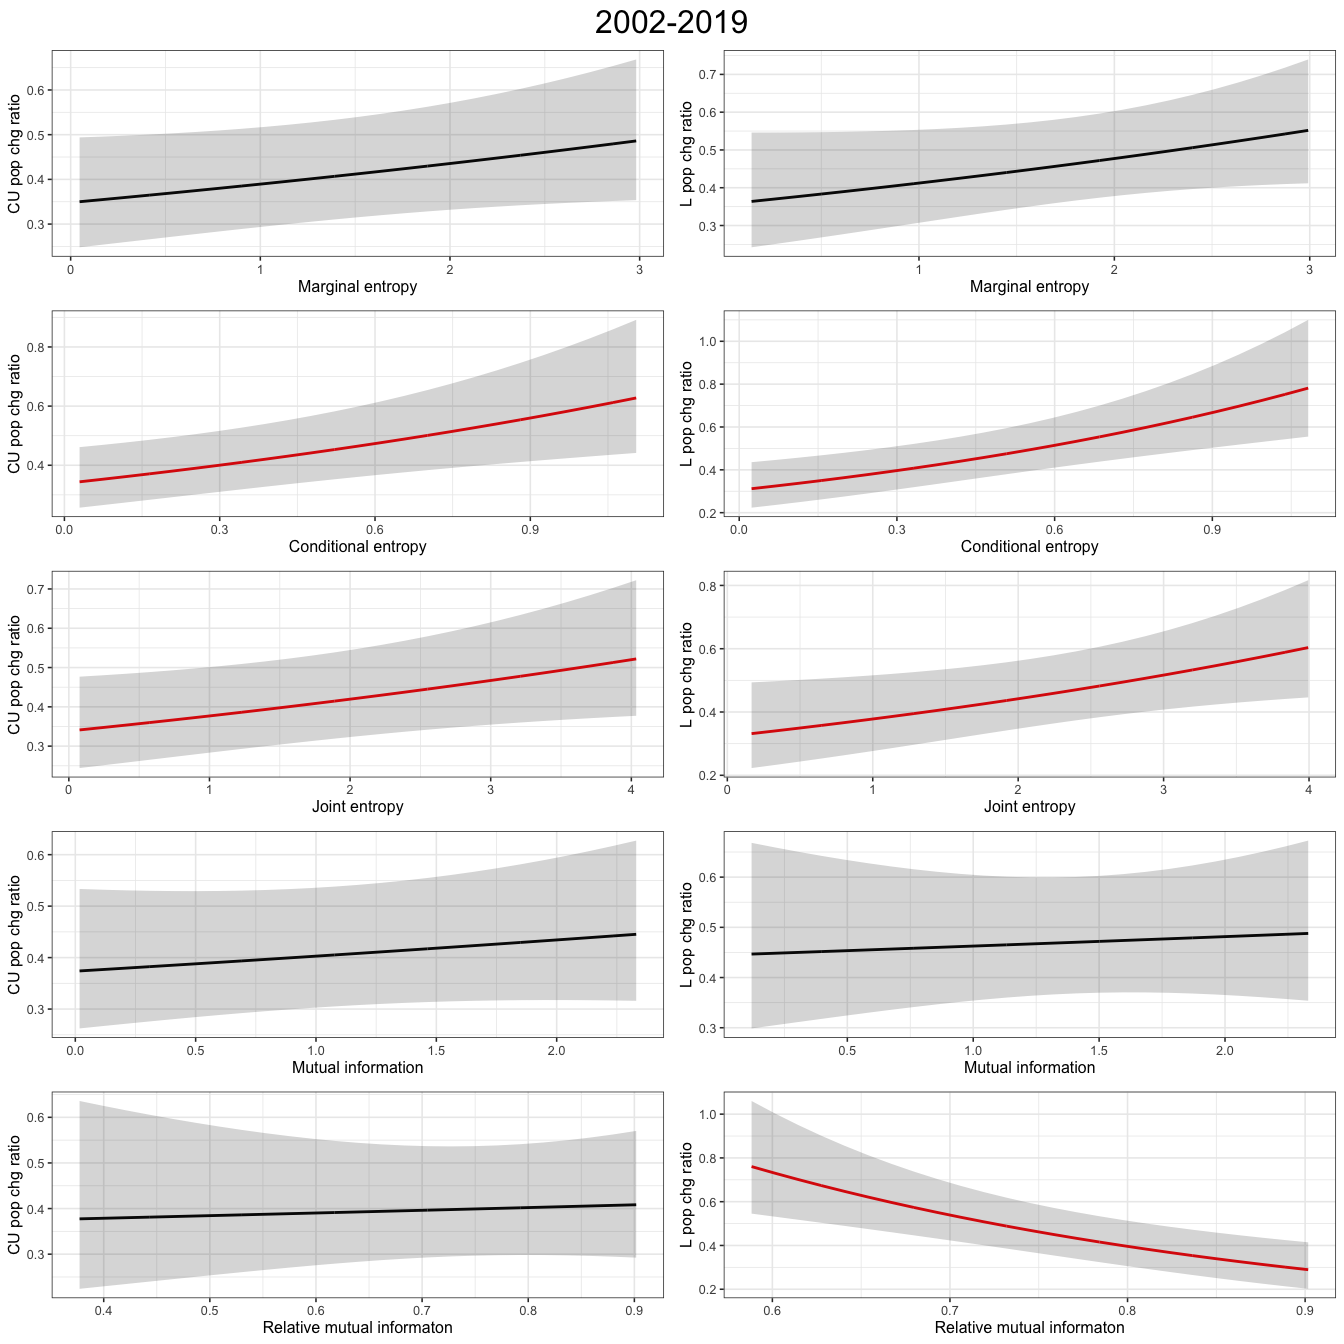
Figure I.1: Plots show population change to information theory covariates for a GAM, across all wader species
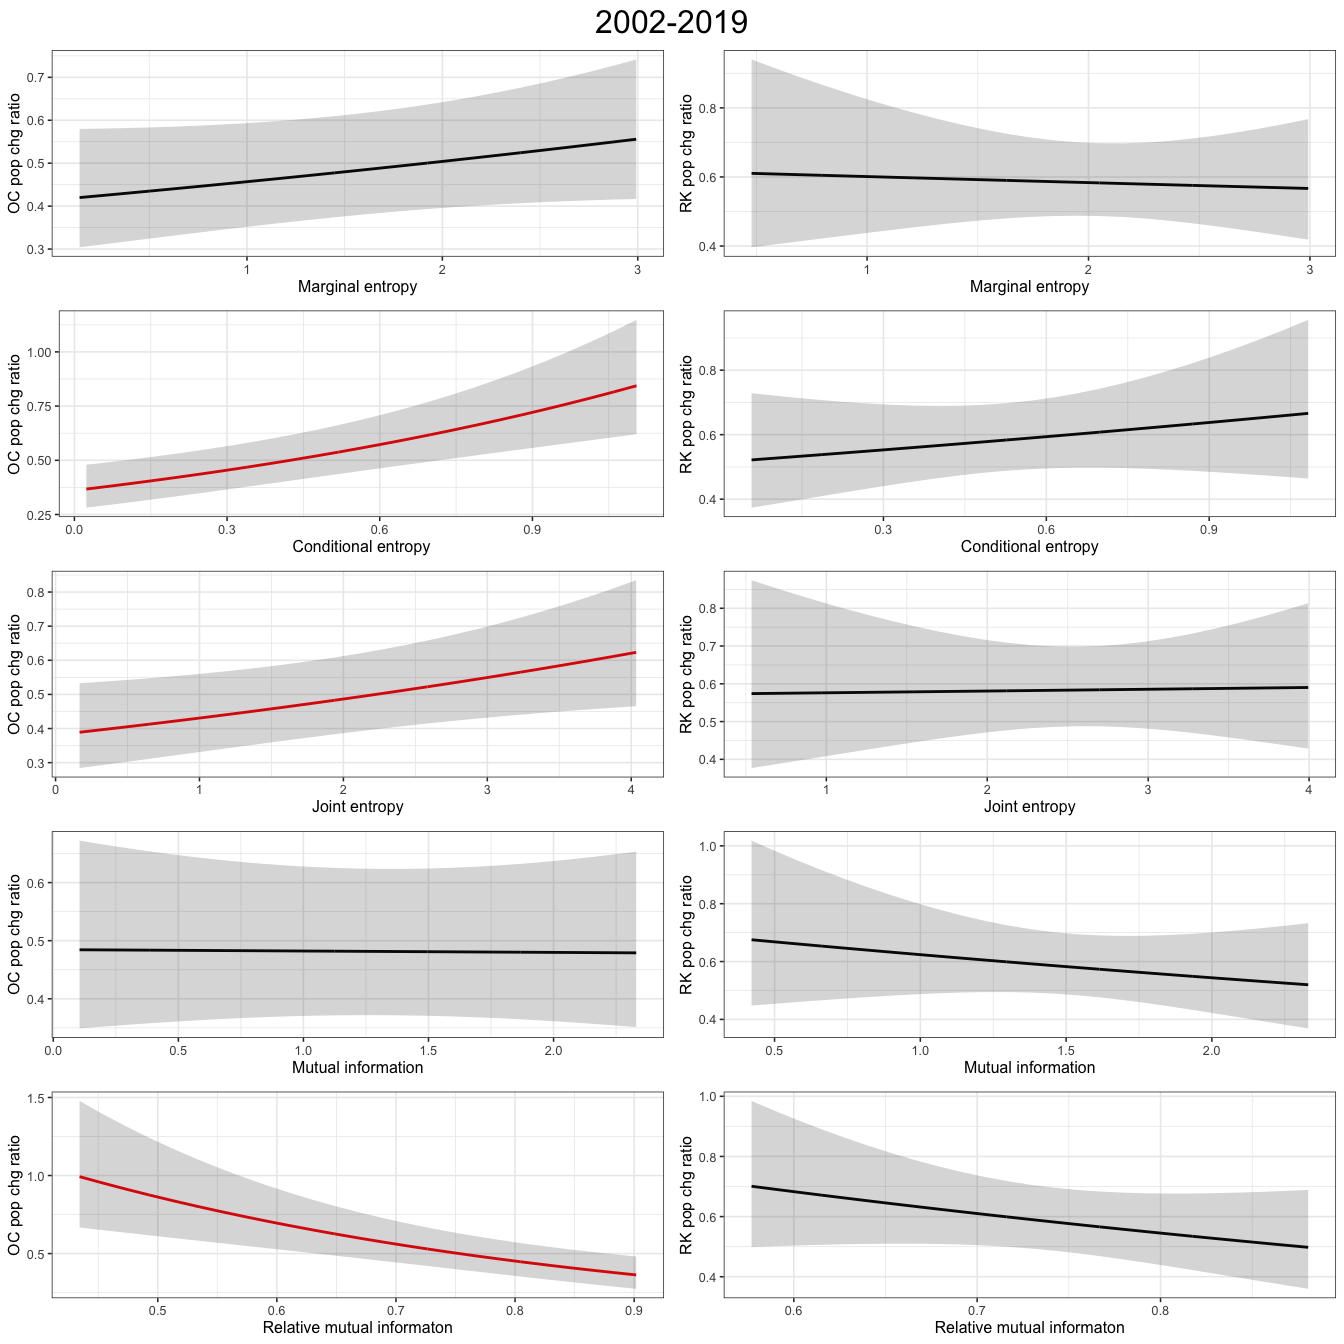
Figure I.2: Plots show population change to information theory covariates for a GAM, across all wader species
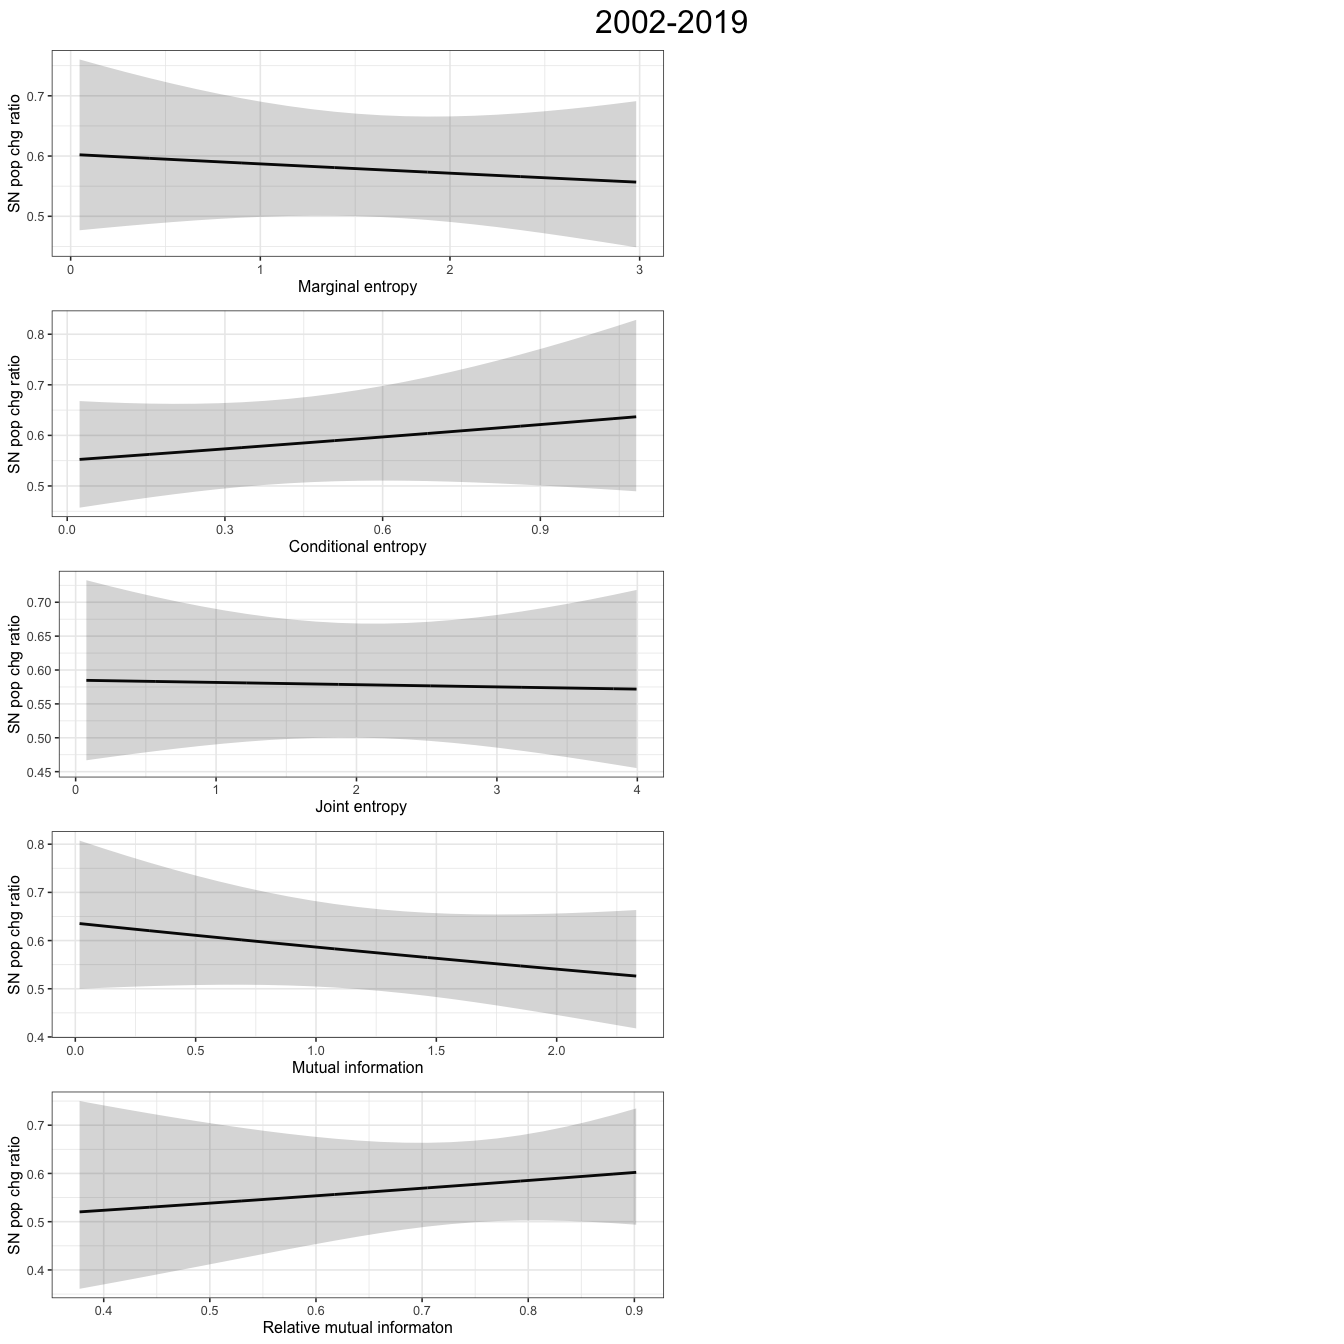
Figure I.3: Plots show population change to information theory covariates for a GAM, across all wader species