Abstract
Acknowledgements
1
Introduction
1.1
Farmland waders
1.2
Declines in wader populations
1.3
Breeding wader abundance response to farmland habitat
1.4
Breeding wader abundance response to landscape composition and scale
1.5
The Shetland archipelago
1.6
Study objective and hypotheses
2
Materials and Methods
2.1
Shetland Breeding Bird Survey
2.2
Estimating detectability
2.3
Exploratory Data Analysis
2.4
Environmental covariates
2.4.1
EUNIS habitat classification raster
2.4.2
Improved grassland habitat classifiction
2.4.3
Median topsoil pH content
2.4.4
Topsoil organic carbon content
2.4.5
Available water capacity
2.4.6
Bare peatland
2.4.7
Distance to sea
2.4.8
Elevation
2.5
Bootstrap analysis of Shetland BBS survey squares
2.6
Wader food response
2.7
Breeding wader density response to environmental covariates
2.8
Breeding wader population change as a response to environmental covariates
2.9
Habitat spatial complexity response
2.10
Wader population abundance modelling
2.11
Lapwing population association with reseeded grassland
2.12
Wader spatial desnity modelling
3
Results
3.1
Explororatory Data Analysis of Shetland BBS survey data
3.1.1
Survey effort over time
3.1.2
Status of population change at survey sites between 2002 and 2019
3.1.3
Outliers
3.1.4
Testing for normality
3.1.5
Poisson distribution and zero inflation
3.1.6
Homogeniety of variance
3.1.7
Survey Bootstrap
3.2
Detectability
3.3
Improved grassland classification
3.3.1
Shetland Sentinel 2 satelitte dataset
3.3.2
Habitiat classification training data
3.3.3
Sampling of habitat training classes
3.3.4
Support vector machine classifier training
3.3.5
Best model results by classification accuracy
3.3.6
Model performance using the test dataset
3.3.7
Classification across all Shetland habitat
3.4
Environmental covariate analysis
3.4.1
Histogram of environmental covariates
3.4.2
Histogram of environmental covariates for Shetland BBS squares only
3.4.3
Density plots of environmental covariates
3.5
Breeding wader abundance response to environmental covariates
3.6
Population change response against environmental covariates
3.7
Information Theory (IT) covariates
3.7.1
Histograms of Information theory covariates
3.7.2
Histograms of Information Theory covariates for surveyed squares only
3.7.3
Information Theory covariates abundance response model
3.7.4
Population change model against IT covarirates
3.8
Wader abundance trends
3.8.1
Tuning the model hyper parameters
3.8.2
Further model hyper parameter tuning
3.8.3
Variable importance in model fit
3.8.4
Breeding wader population estimates from 2002 to 2019
3.8.5
Lapwing abundance association with grassland holdings
3.9
Spatial abundance distriution of breeding waders
3.9.1
Net spaital abundance change by species, between 2002 and 2019
4
Discussion
4.1
Discussion of evidence for each hypothesis
4.1.1
Improved grassland coverage (H1)
4.1.2
Topsoil organic carbon content (H2)
4.1.3
pH (H3)
4.1.4
Heathland percentage coverage (H4)
4.1.5
Grassland percentage coverage (H5)
4.1.6
Bog percentage coverage (H6)
4.1.7
Elevation (H7)
4.1.8
Distance from the sea (H8)
4.1.9
Bare peat percentage coverage (H9)
4.1.10
Available water capacity (H10)
4.1.11
Landcover heterogeneity (H11)
4.1.12
Landcover homogeneity (H12)
4.2
Shetland breeding wader population trends
4.3
The significance of soil health for breeding wader populations
4.4
Covariates that were not explored and future work
4.5
Conclusion
References
Appendix
A
Spatial plots of environmental covariates
B
Parameters for GAM abundance response model
C
Plots for GAM abundance response model
D
Parameters for GAM population change response model
E
Plots for GAM population change response model
F
Parameters for abundance response with information theory covariates
G
Plots for abundance response with information theory covariates
H
Parameters for population change response model with informtion theory covariates
I
Plots for population change response model with informtion theory covariates
J
Abundance model hyper parameters for initial fit
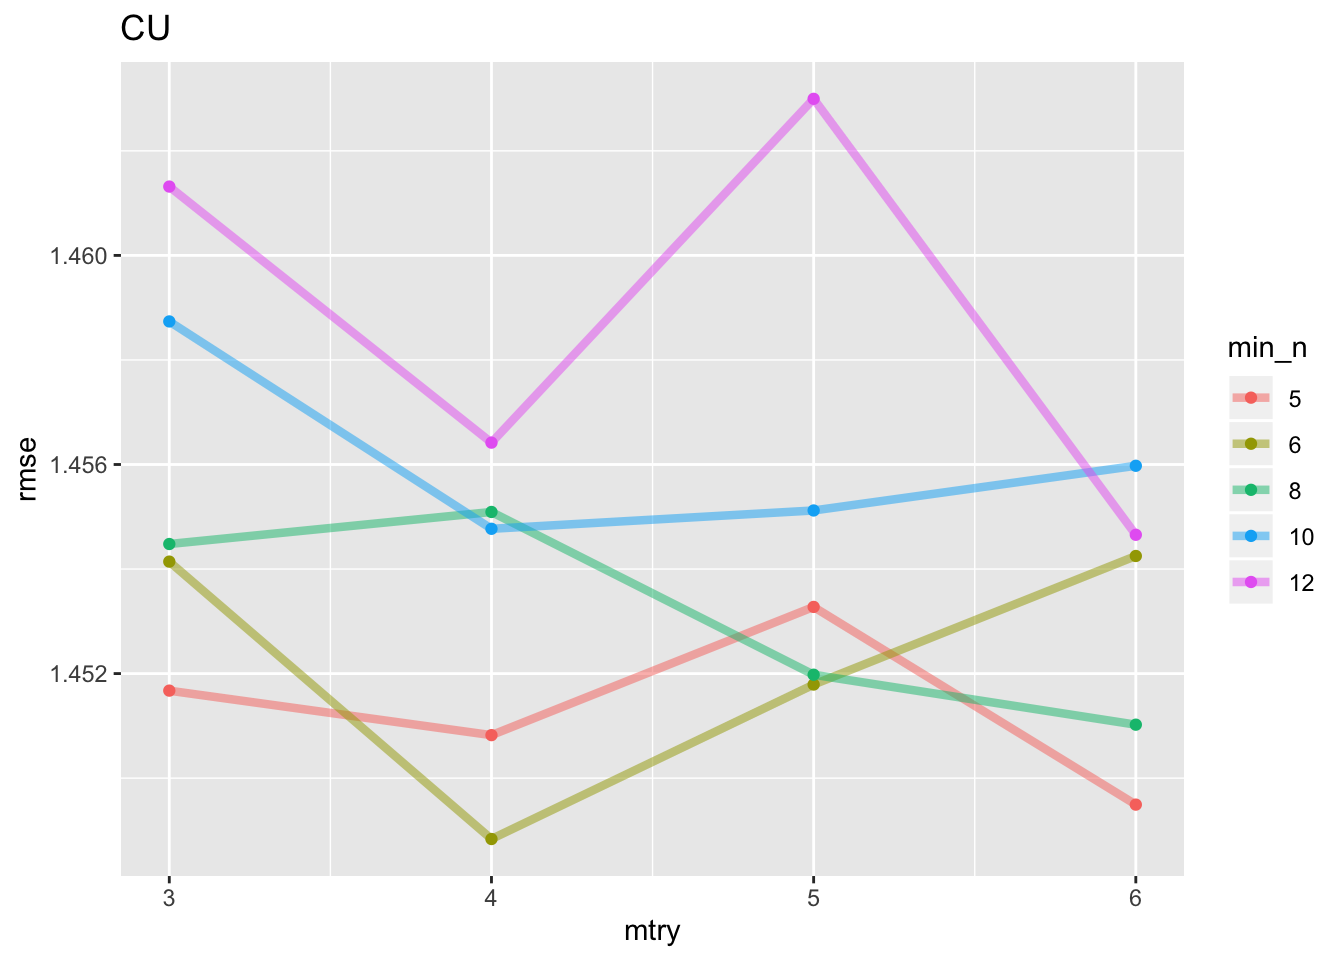
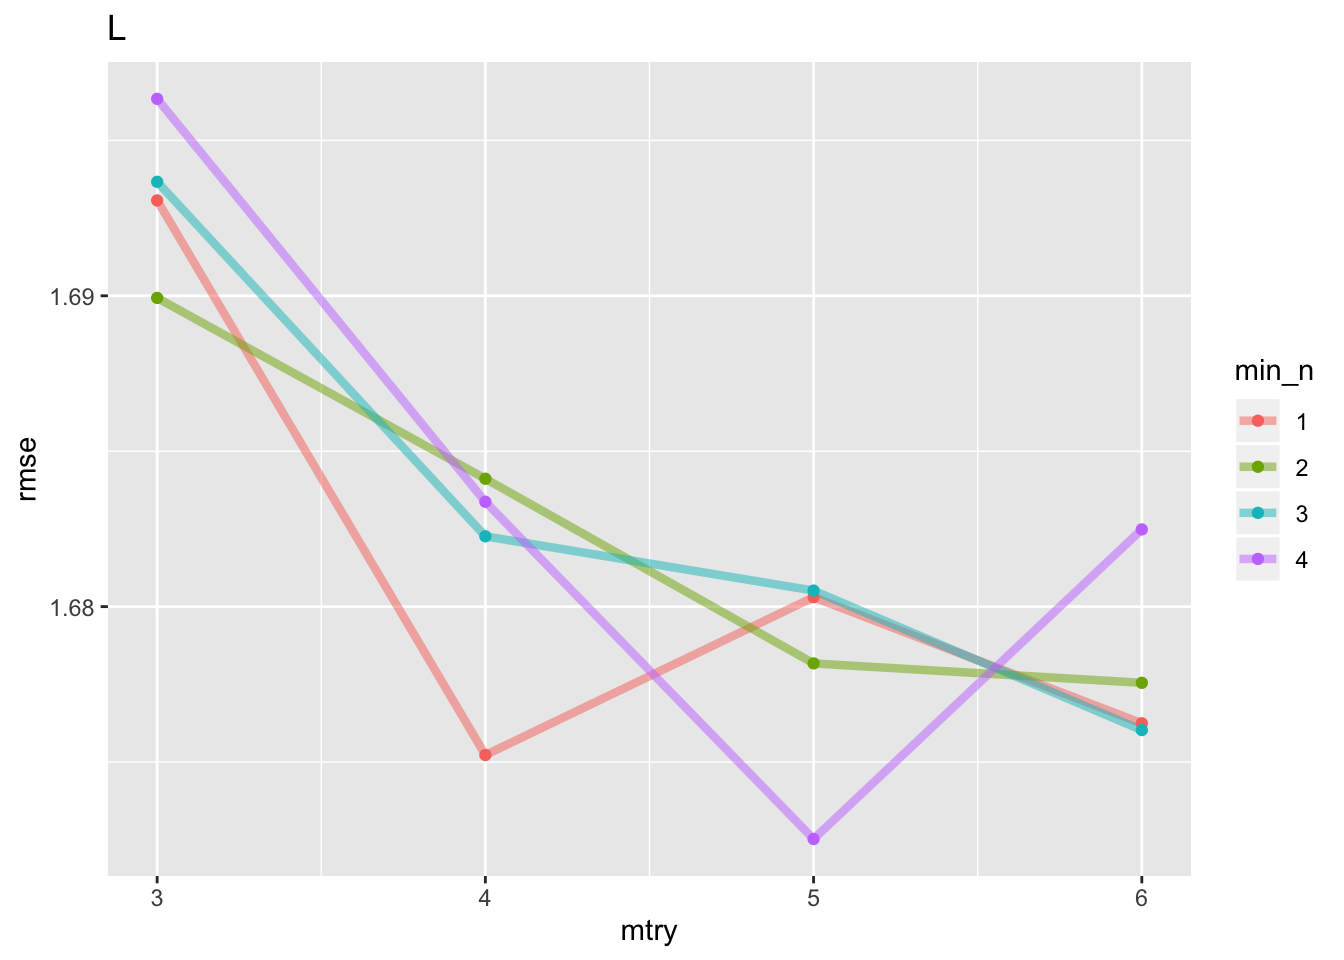
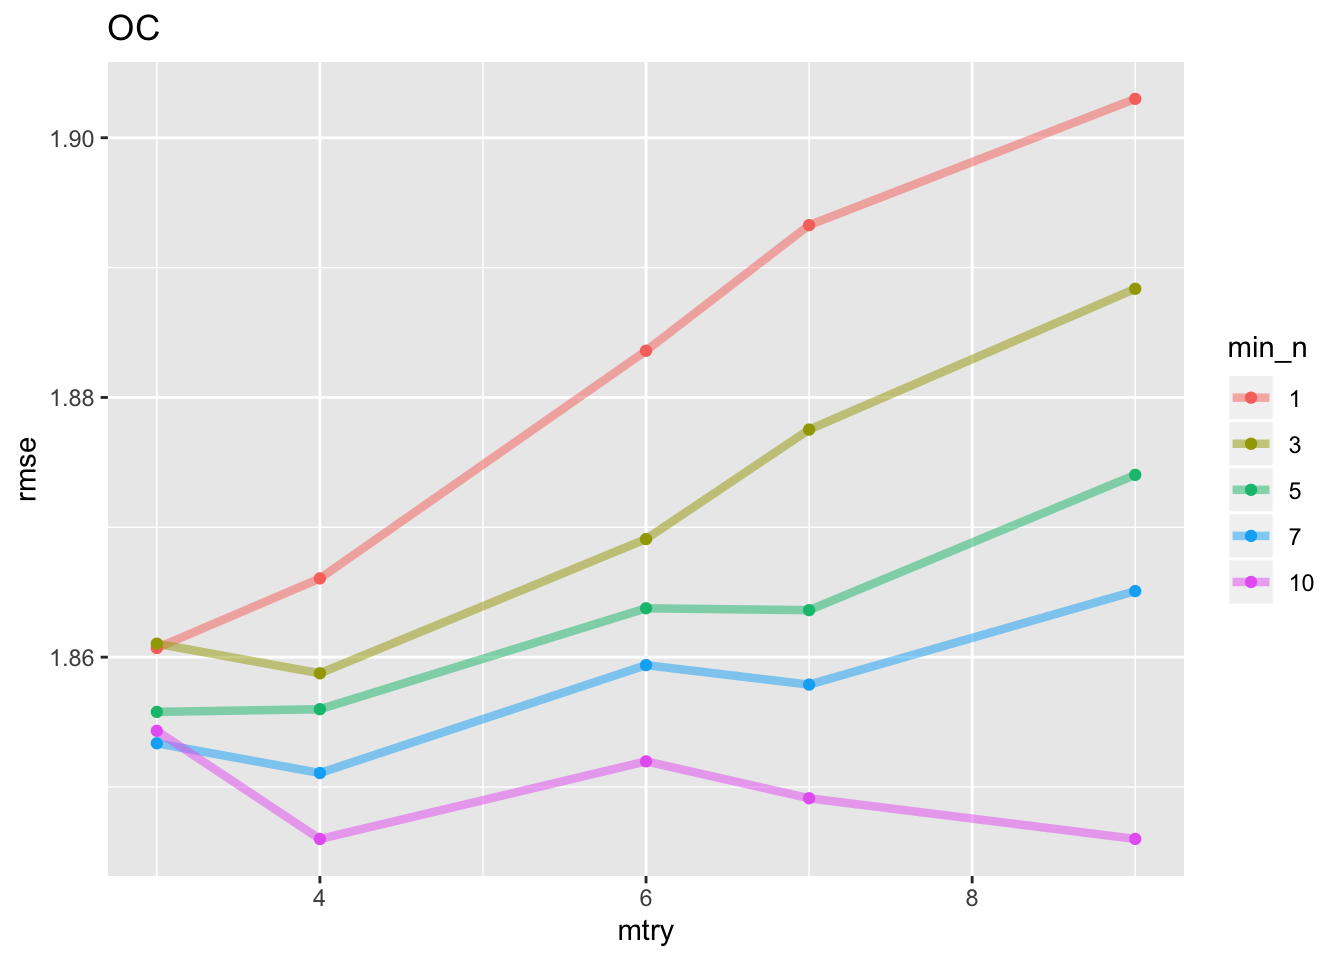
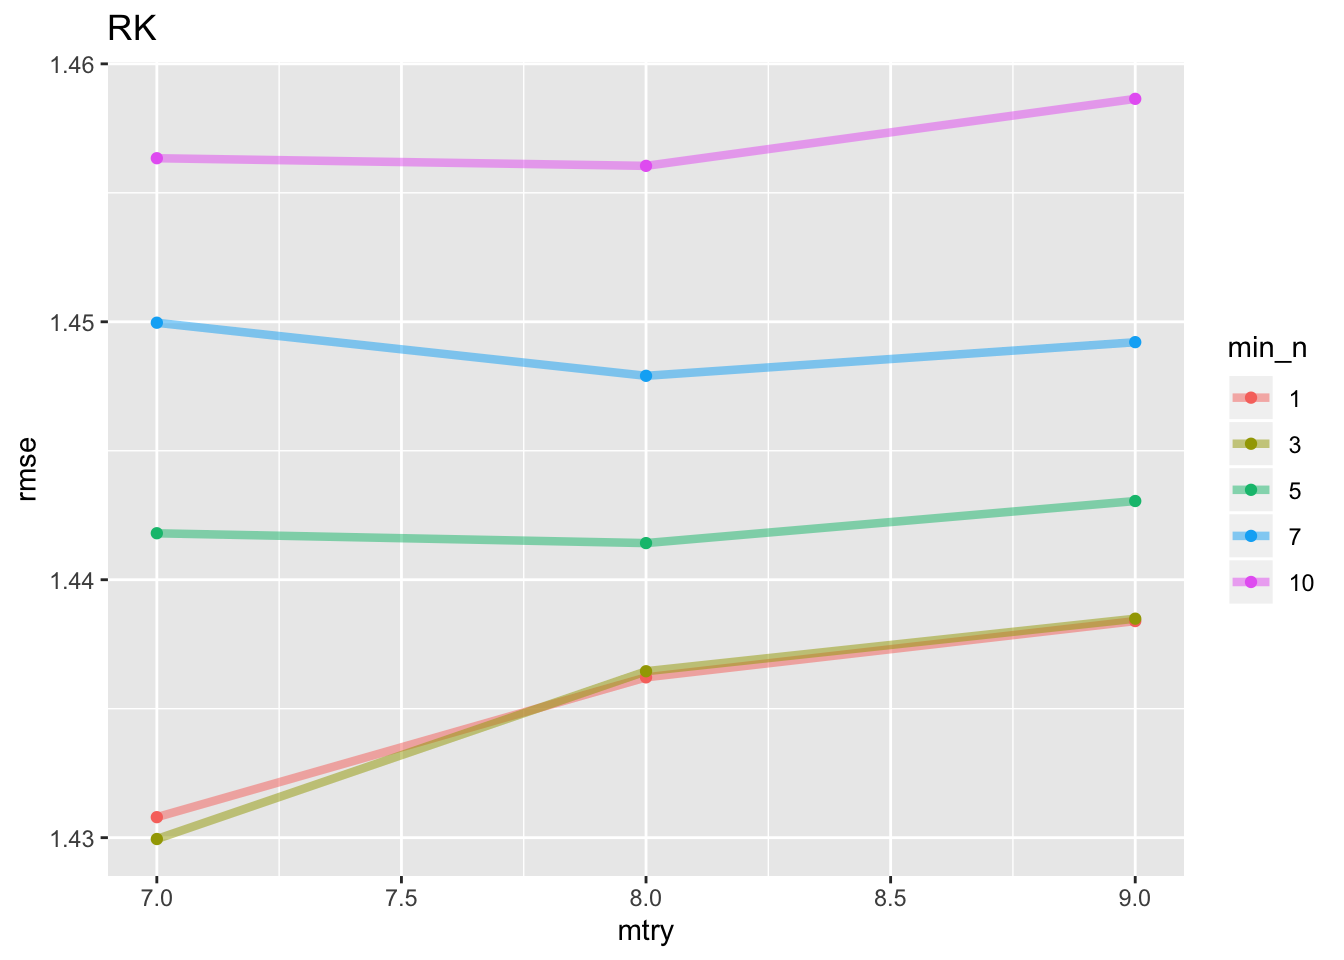
K
Abundance model hyper parameters final fit
L
Abundance model variable importance plots
M
Shetland breeding wader population estimates (numbers of pairs)
Assessing the habitat response of breeding farmland waders in Shetland
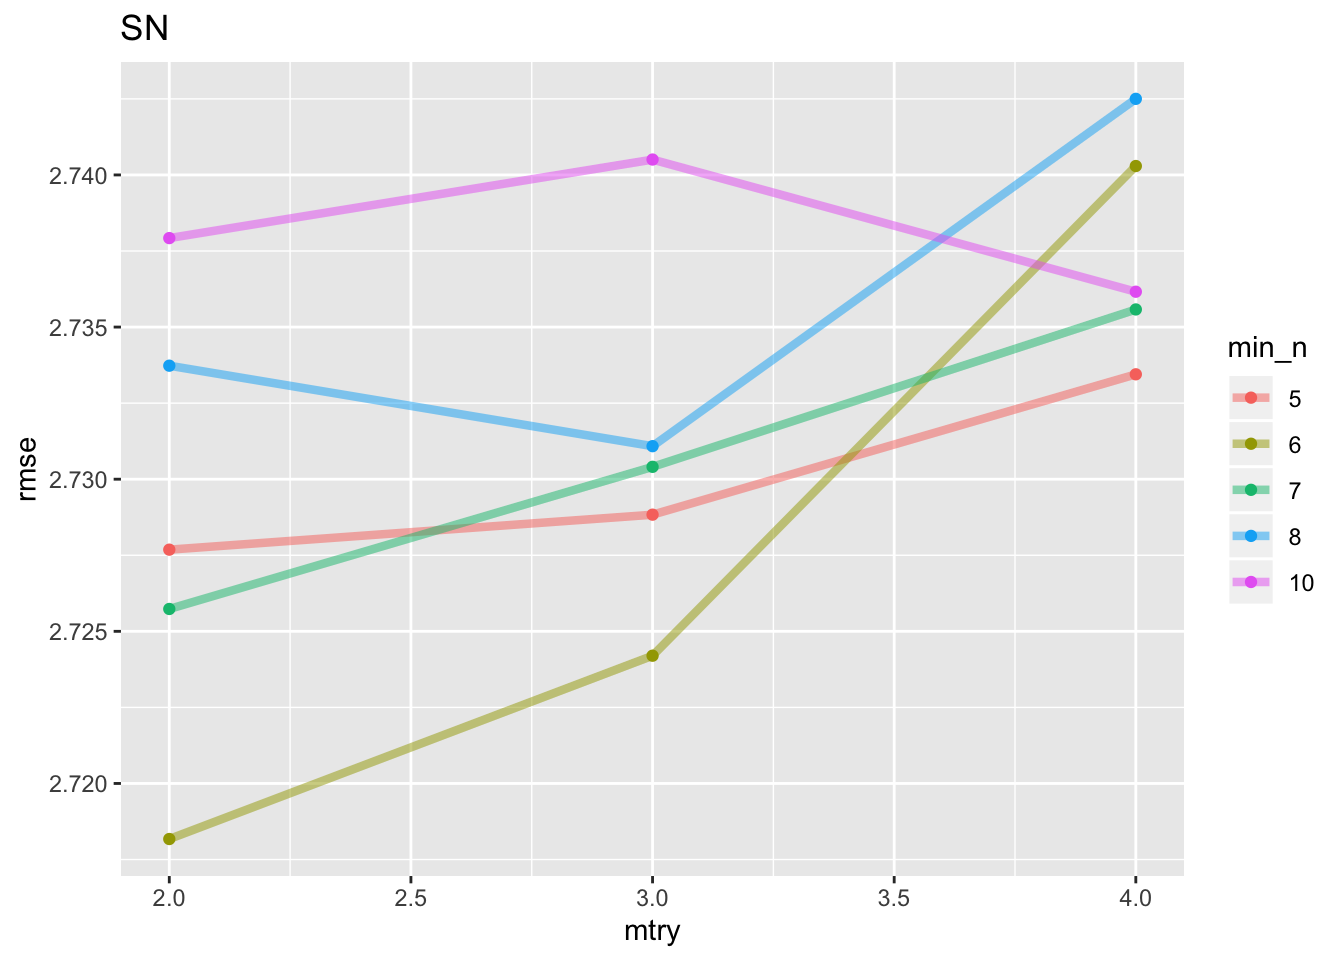
K
Abundance model hyper parameters final fit
## [[1]]
##
## [[2]]
##
## [[3]]
##
## [[4]]
##
## [[5]]